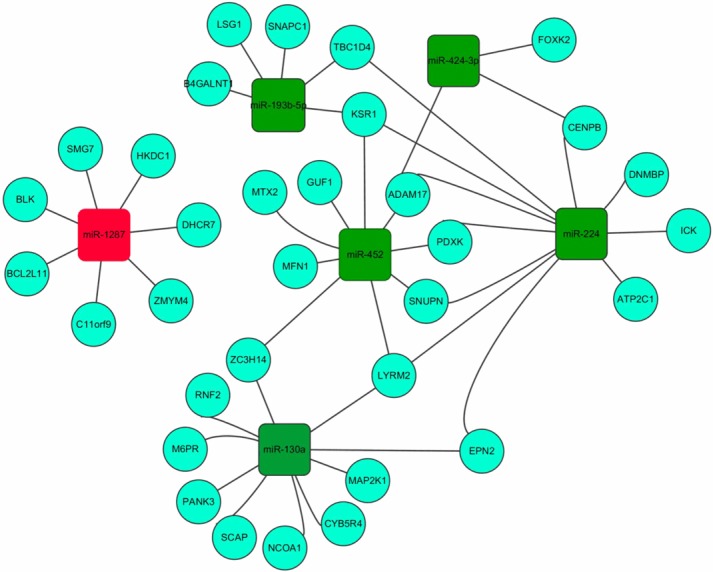
Figure 5.

MiR-gene network. The 10 miRs with the most significantly changes in gene expression were examined with miRWalk online software to predict the downstream putative target genes. The identified targets were compared to the genes with altered expression (68 with increased expression and 55 with decreased expression in the PTX-resistant cell line) determined by microarray. The overlapping genes were considered potential downstream targets and used to construct the miR-gene network using Cytoscape 2.8 software. The red square represents the miRs with increased expression, and the green squares represent the miRs with decreased expression. The circle represents the gene; the gray line represents the regulation of the gene by miRs.
