
Figure 2.
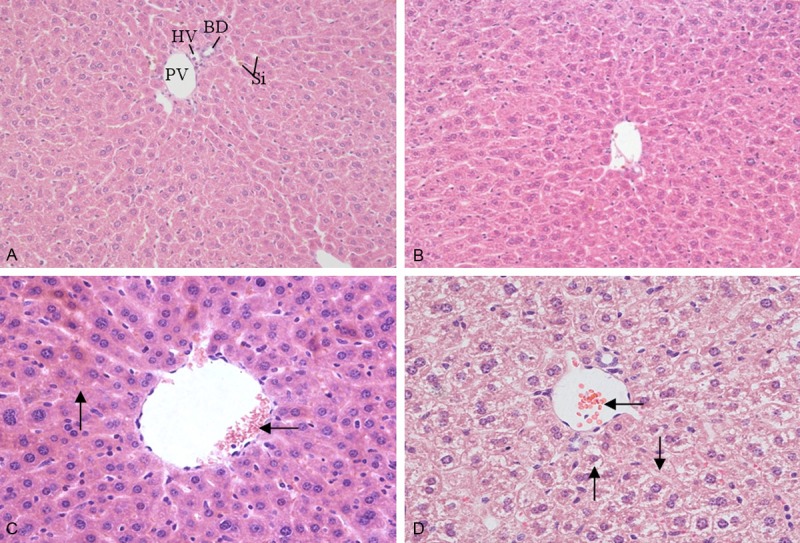
Effect of 1,8-cineole on the microstructures of liver in mice after administration for 30 days. A: Group I (0 mg/kg, HE 200×), control group showed hepatic artery (HA), portal vein (PV), bile duct (BD), sinusoids (Si); B: Group II (21.38 mg/kg, HE 200×), showed the normal characteristics of hepatic lobule; C: Group III (64.15 mg/kg, HE 400×), showed central venous congestion of liver lobule (←) and granular degeneration of hepatocytes (↑); D: Group IV (192.45 mg/kg, HE 400×), showed central venous congestion (←), granular degeneration and vacuolar degeneration (↑) and necrosis (↓) in hepatic cells.