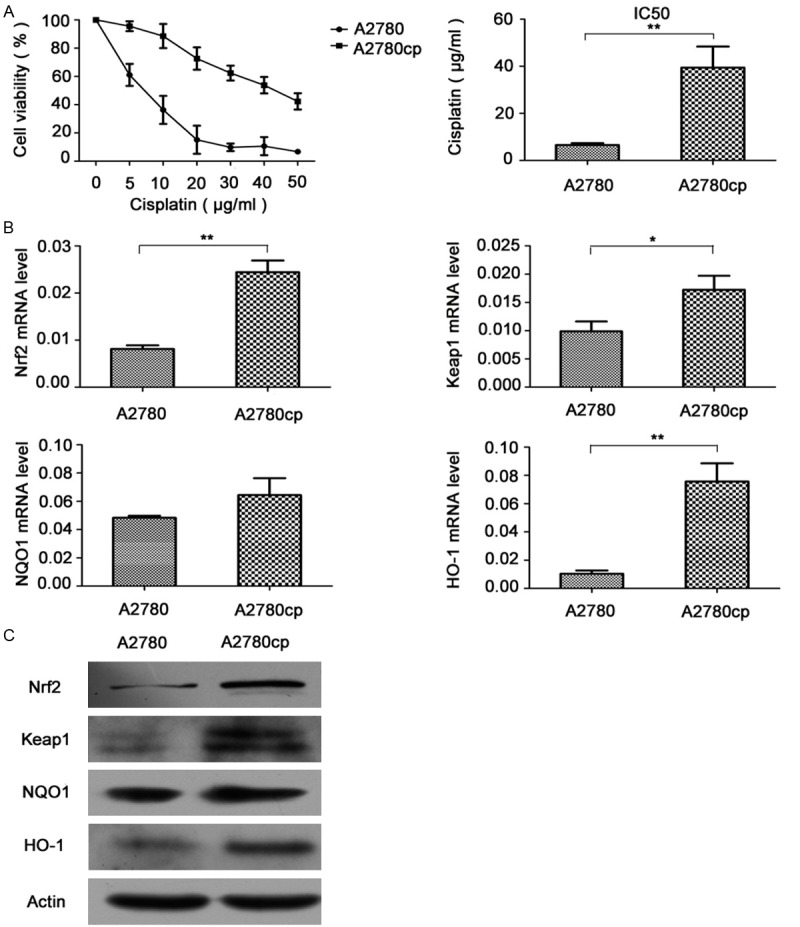
Figure 1.

Expression of Nrf2 pathway genes in A2780 and A2780cp cell lines. A. Cells were treated with different concentrations (5 μg/ml-50 μg/ml) of cisplatin for 24 h. Cell viability was determined using a WST-8 assay. Data (mean ± SD) represent the mean value of three independent experiments. *P<0.05. B. RNA extracted from cells was subjected to mRNA level examination using a real-time PCR kit. Data (mean ± SD) represent the mean value of three independent experiments. *P<0.05, **P<0.01. C. Cell lysates were collected for western blot analyses for Nrf2, Keap1, NQO1 and HO-1 protein detection.
