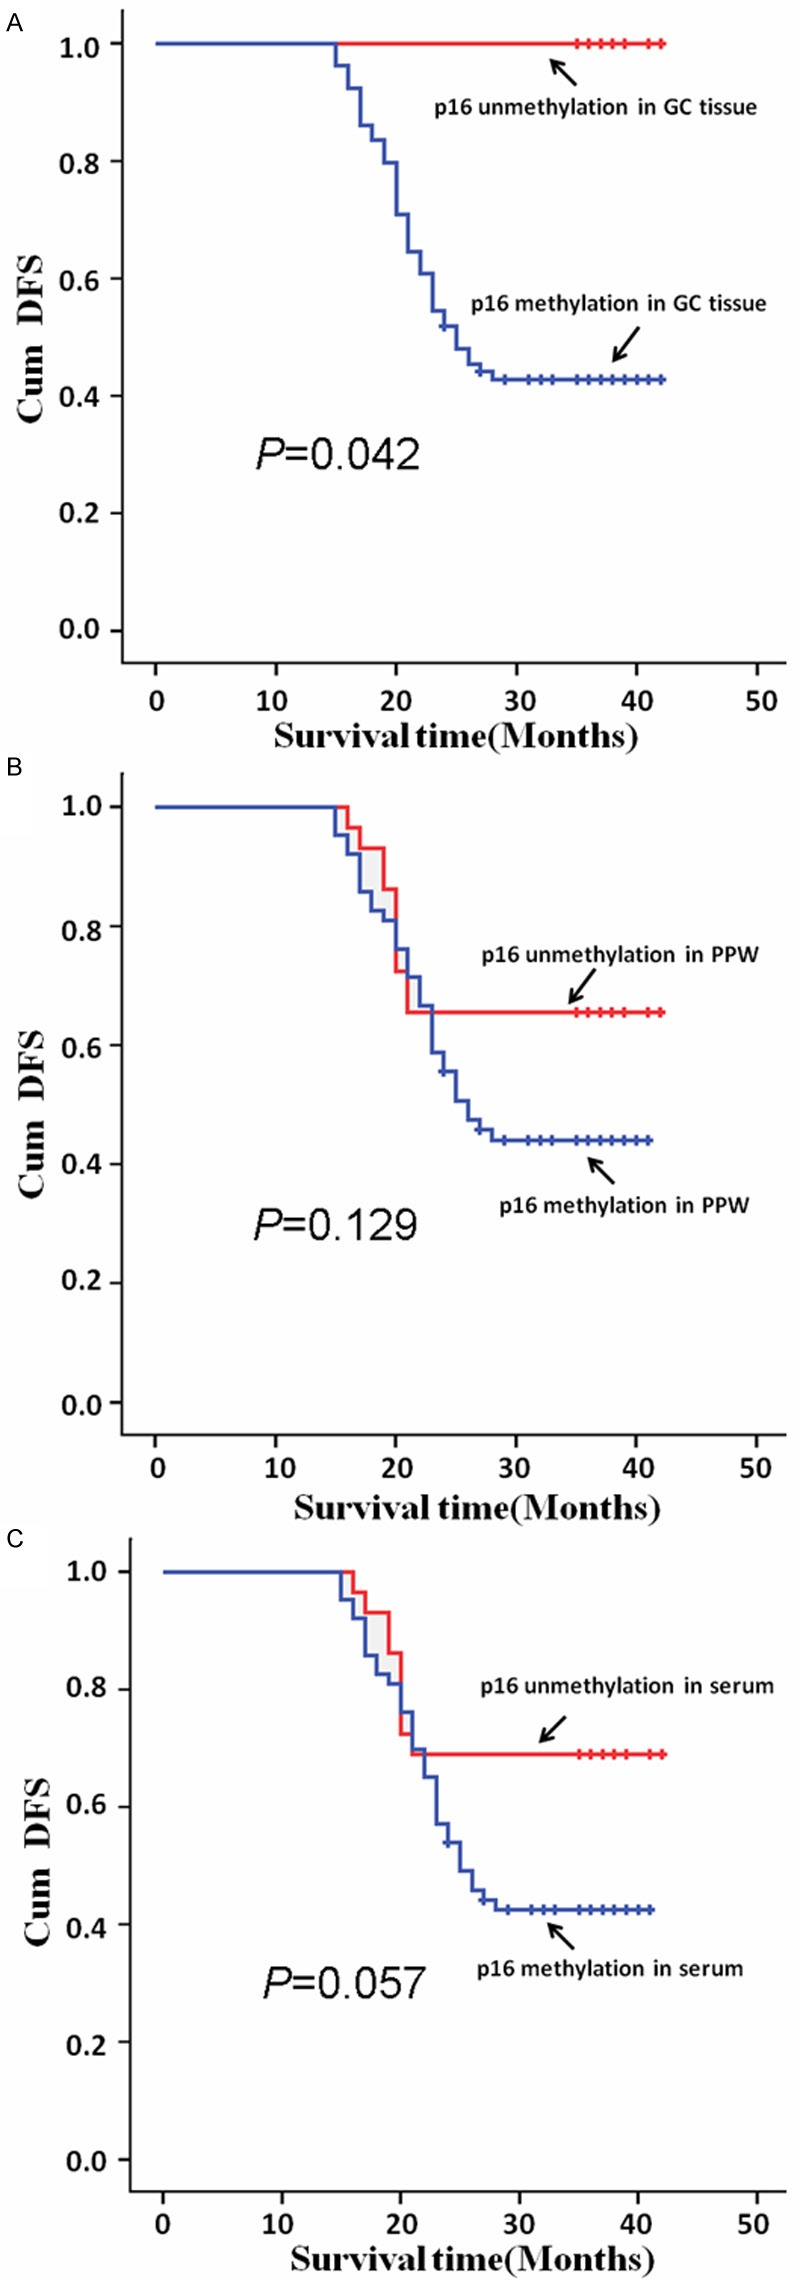
Figure 4.

p16 hypermethylation in GC tissues and PPWs or serums correlated with patients’ prognosis. Cumulative disease-free survival (Cum DFS) curves are plotted against p16 DNAs hypermethylation level in GC tissues (A), in the PPWs (B) and in serums (C). In A-C, Kaplan-Meier analysis were used and P was 0.042, 0.129 and 0.057, respectively.
