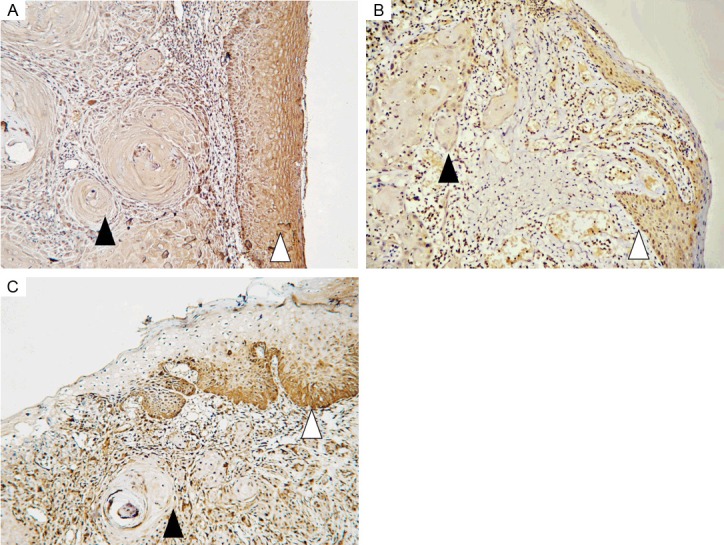
Figure 2.

Representative immunohistochemical staining for NOD1 (A), RIP2 (B) and Caspase12 (C) at the border between cancer nest area of OSCC and surrounding dysplastic epithelium area. Closed arrowheads indicate cancer nest areas, while open arrowheads indicate dysplastic epithelium areas. Original magnification: 100×.
