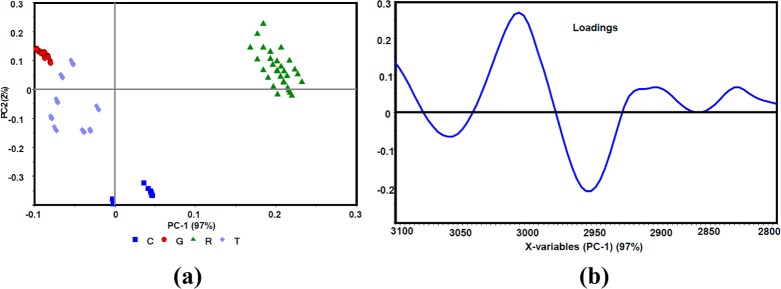
Figure 3.

(a) PCA scores plot along PC1 and PC2 of control (C) and ring (R), trophozoite (T), and gametocyte (G) -infected RBC data sets. (b) PC1 correlation loadings plot after a second-derivative function was applied to the C–H stretching region (3100–280 cm–1).
