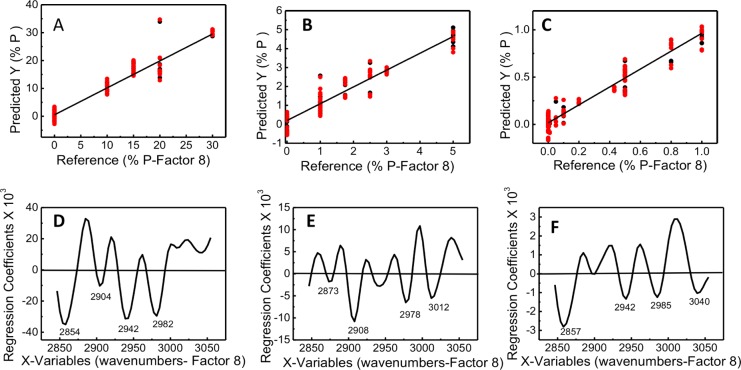
Figure 6.
Regression plots for calibration and validation sets for three ranges of early ring-stage parasitemia: (A) model 1 (%) 0, 10, 15, 20, and 30; (B) model 2 (%) 0, 1, 1.75, 2.5, 3, and 5; and (C) model 3 (%) 0, 0.00001, 0.005, 0.01, 0.05, 0.1, 0.2, 0.4, 0.5, 0.8, and 1. Also shown are the corresponding regression coefficient plots (panels D–F, respectively) for 8-factors.

