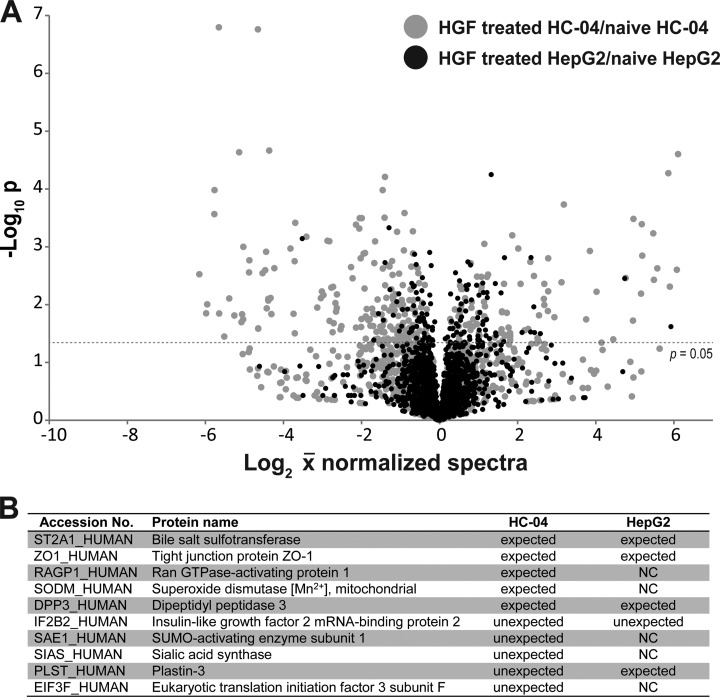
Fig. 5.
Proteomic analysis of HepG2 following HGF treatment compared with the HC-04 response to HGF. We applied online 2D methods to profile protein expression in naïve and HGF treated HepG2 (supplemental Table S7). A total of 1759 and 1757 protein groups were identified in HepG2-naive samples and HGF-treated samples, respectively. A, Volcano plot of the quantifiable proteomes of HepG2 (black points) and HC-04 (gray points) comparing protein levels before and after HGF treatment. These plots demonstrate the more drastic change in HC-04 following HGF treatment, suggesting that HC-04 is at a different point on the EMT spectrum that other common HCC. B, Observed protein regulation in naïve and hepatocyte growth factor (HGF) treated HepG2 cells in comparison to expected or unexpected changes of HC-04 cells following acute exposure to HGF (from Table I). With the exception of IF2B2, all HepG2 examples either changed in an expected manner based on the epithelial-mesenchymal transition, did not change more than 0.1 fold (NC), or were not detected. Data is based on three biological replicate experiments (shown in supplemental Table S7).

