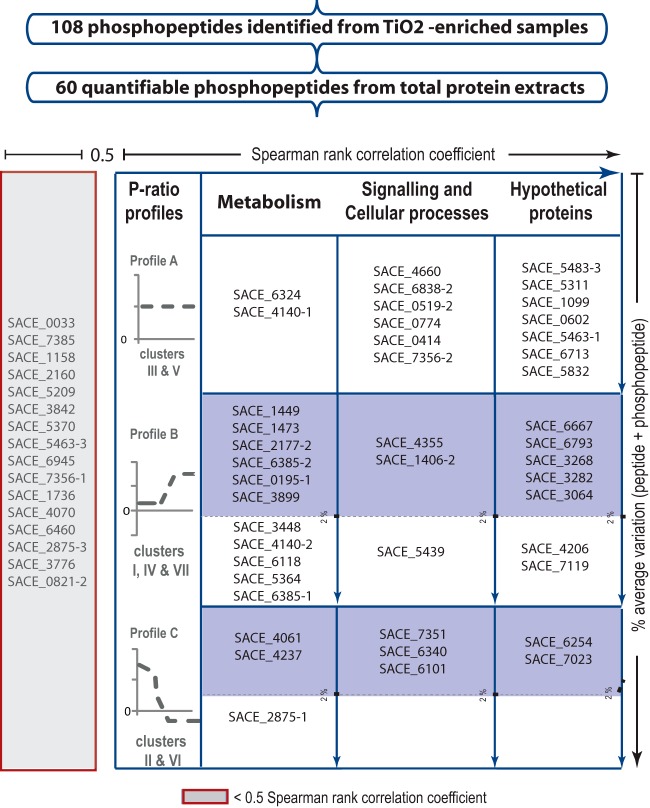
Fig. 3.
Selection criteria employed for the identification of proteins potentially regulated by phosphorylation. The signal-to-noise ratio was first verified independently for two biological replicates. A total of 60 quantifiable phosphopeptides were obtained. The Spearman rank correlation coefficient was estimated using a cutoff threshold of 0.5 (horizontal axis). The resulting 44 phosphopeptides were clustered according to their phosphorylation ratio profiles and classified into three function categories (“Metabolism,” “Signaling and Cellular Processes,” and “Hypothetical Proteins”) according to the genome annotation. A total of 29 phosphopeptides showed dynamic behavior (table, second and third rows). The total amount of peptide quantified was estimated by adding the peak area of peptide + phosphopeptide across the time course, and a maximum average variation of 2% was used as a threshold (blue-shaded boxes). For simplicity, the recent genome annotation has been omitted from the figure.

