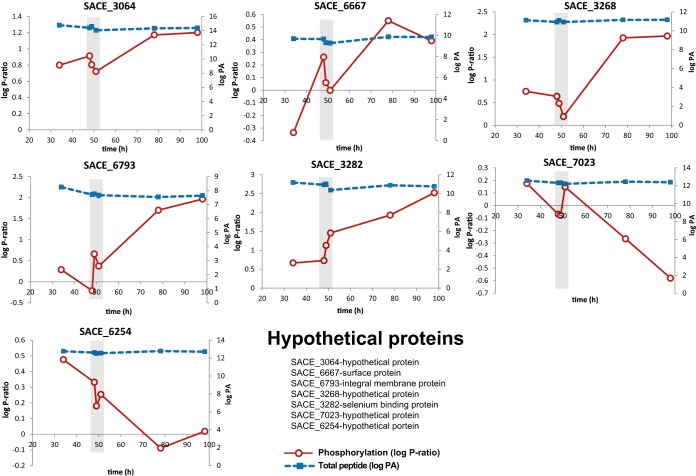
Fig. 4.
Two-dimensional plots of hypothetical proteins with dynamic phosphorylation profiles across the fermentation. The phosphorylation ratio (log P-ratio) and total peptide (log peak area (PA)) are plotted as solid red and dotted blue lines, respectively. Graphs represent SACE_3064/NC_009142_3026 (upper left panel); surface protein, SACE_6667/NC_009142_6544 (upper middle panel); SACE_3268/NC_009142_3226 (upper right panel); SACE_6793/NC_009142_6674 (middle left panel); selenium binding protein, SACE_3282/NC_009142_3240 (middle center panel); SACE_7023/NC_009142_6904 (middle right panel); and SACE_6254/NC_009142_6132 (lower left panel). Total peptide measurements were estimated as log (peak area of phosphopeptide + log peak area of peptide). For simplicity, the recent genome annotation has been omitted from the figure.

