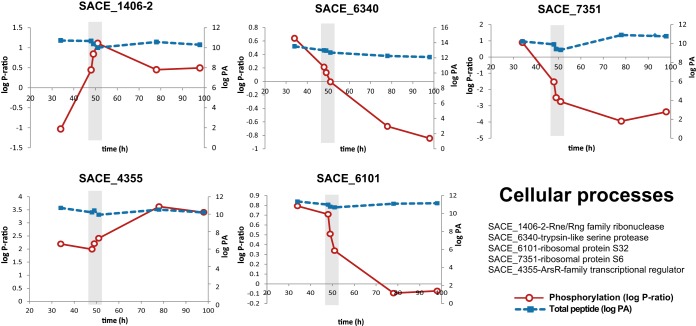
Fig. 6.
Two-dimensional plots of proteins related to cellular processes displaying dynamic phosphorylation profiles across the fermentation. The phosphorylation ratio (log P-ratio) and total peptide (log peak area (PA)) are plotted as solid red and dotted blue lines, respectively. Graphs represent Rne/Rng family ribonuclease, SACE_1406–2/NC_009142_1388–2 (upper left panel); trypsin-like serine protease, SACE_6340/NC_009142_6216 (upper middle panel); ribosomal protein S6, SACE_7351/NC_009142_7233 (upper right panel); ArsR family transcriptional regulator, SACE_4355/NC_009142_4304 (lower left panel); and ribosomal protein S32, SACE_6101/NC_009142_5981 (lower middle panel). Total peptide measurements were estimated as log (peak area of phosphopeptide + log peak area of peptide). For simplicity, the recent genome annotation has been omitted from the figure.

