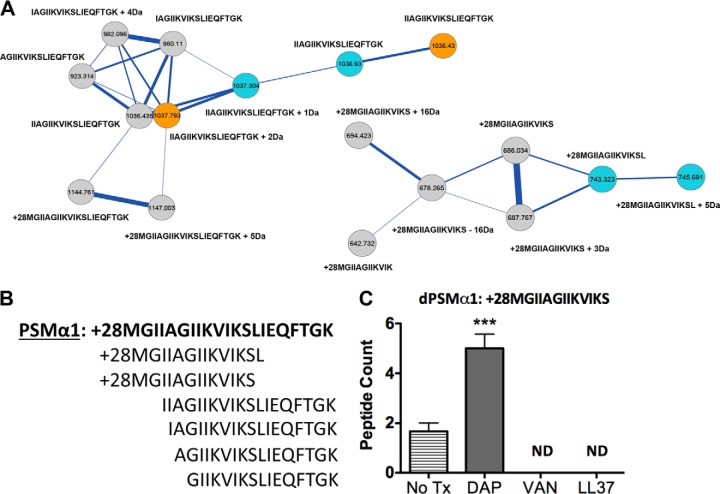
Fig. 2.
PSMα1 and related variants upon exposure to challenged conditions. A, The molecular network resulting from ion clusters of PSMα1 is shown. Nodes colored blue are ion clusters found only in daptomycin challenged conditions. Nodes colored gold are found only in MRSA alone samples. Nodes colored gray are found in MRSA + daptomycin challenged conditions. Nodes labeled with only a sequence tag are within 500 ppm of the accurate theoretical mass. Nodes labeled with sequence tags plus (+) numbers have their mass accuracy noted. A sub-nodal cluster of PSMα1 is also shown with clusters from daptomycin (colored blue) and MRSA + daptomycin (colored gray). B, Sequence of PSMα1 is shown in bold followed by its related variants. C, Spectral counts for the formylated 13-mer peptide under respective challenged conditions. PSMα1 variants were not detected (ND) in the vancomycin treated sample. Analysis of the all nodes in the different conditions containing dPSMs is provided in supplemental material.

