Fig. 2.
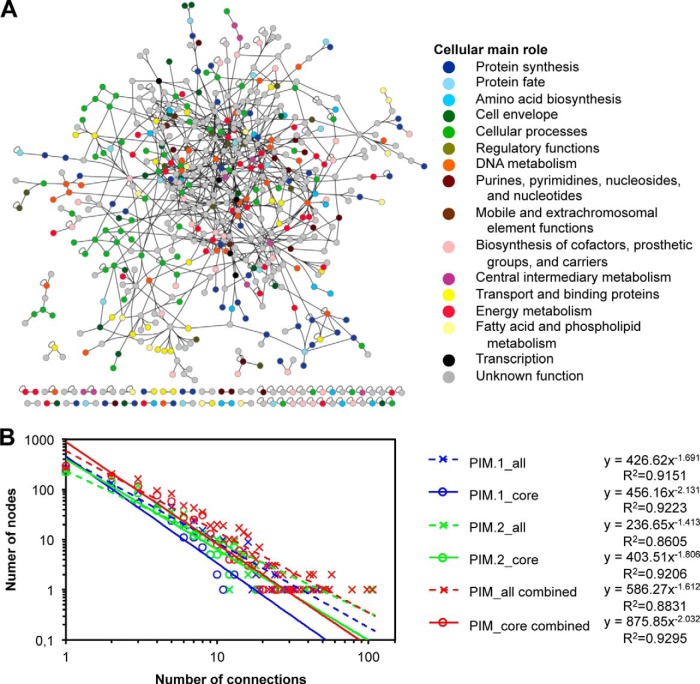
The H. pylori protein interaction map. A, The core interaction map (PIM.2_core) involves 596 proteins connected by 908 interactions shown as nodes and edges, respectively. Proteins are colored according to their cellular main role (9). Graph drawn with Cytoscape 3.0.0-beta1(47). B, Degree distributions of different H. pylori PIM subsets (log. scale). The regression function and R2 coefficients shown represent the power law fit yields. “PIM.1_all” all PPIs from (20); “PIM.1_core”: PPIs in PBS categories A+B (20). “PIM.2_all” all PPIs from this study; “PIM.2_core”: core PPIs from this study. The “combined” data sets contain either all or only the core data sets of both studies.

