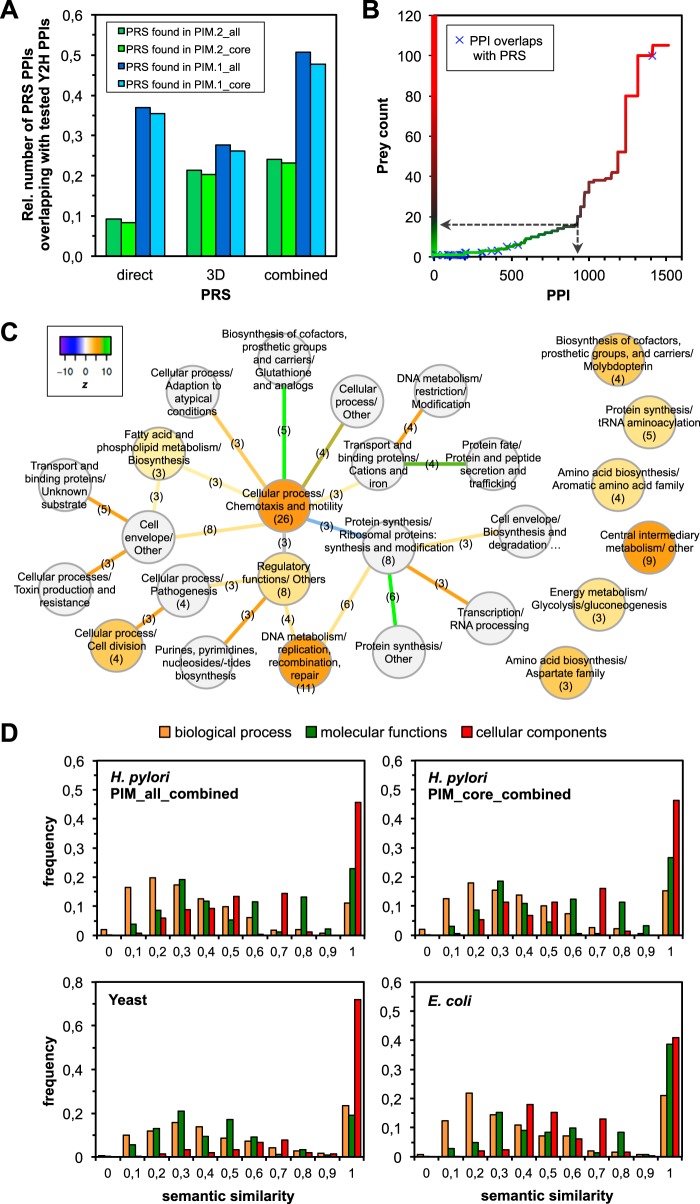
Fig. 3.
Data benchmarks and functional groups. A, Screening sensitivity: detected interactions in PIM.2 (this study) and PIM.1 (20) when compared to interactions known from the H. pylori literature (PRS, supplemental Table S3); “direct” PPIs with proteins that are known to bind directly to each other, “3D” PPIs from three-dimensional protein structures, “Combined” either direct PPI or from structure. B, All PPIs of PIM.2 sorted by prey count. Overlaps with the PRS are highlighted by blue crosses. Except one interaction all of them map to low prey counts, that is, these PPIs are specific. The prey count threshold (≤15) to propose a core data set is indicated by dashed arrows. C, Enrichment of PPIs among functional protein groups in the combined core PIM (CMR cellular subrole (9)). The z-score compares the number of PPIs to the average number of links in randomized networks. Functional groups are given as nodes and the interactions as edges (color indicates the z-score). Numbers reflect the absolute numbers of interactions within a functional group or connecting different functional groups, respectively. D, Semantic similarity between GO terms of interacting proteins of H. pylori, E. coli, and yeast, focusing on biological processes, molecular function and cellular components. The interactomes of all three species are similar.

