
Fig. 1.
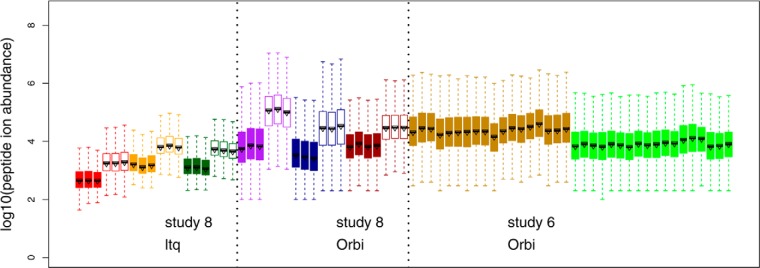
Raw peptide ion intensities from CPTAC Study 8 (no SOP) and a subset of runs from Study 6 (with SOP). Data in Study 8 include 2 LTQs and 3 Orbitrap instruments. Three experimental runs of two samples (2 μl injections), 60 ng/μl (“low,” filled boxplots) and 300 ng/μl (“high,” unfilled boxplots) of the yeast material (Sample QC2) were included in the analysis of Study 8. For Study 6, a subset of runs on two Orbitraps were also included. The runs were plotted in the order specified as below, each with three replicates: (1) Sample 6A yeast + UPS1 at 0.25 fmol/μl, (2) Sample 6B, yeast + UPS1 at 0.74 fmol/μl, (3) Sample 6C, yeast + UPS1 at 2.2 fmol/μl, (4) Sample 6D, yeast + UPS1 at 6.7 fmol/μl, (5) Sample 6E, yeast + UPS1 at 20 fmol/μl, (6) Sample 6-QC2 yeast only.