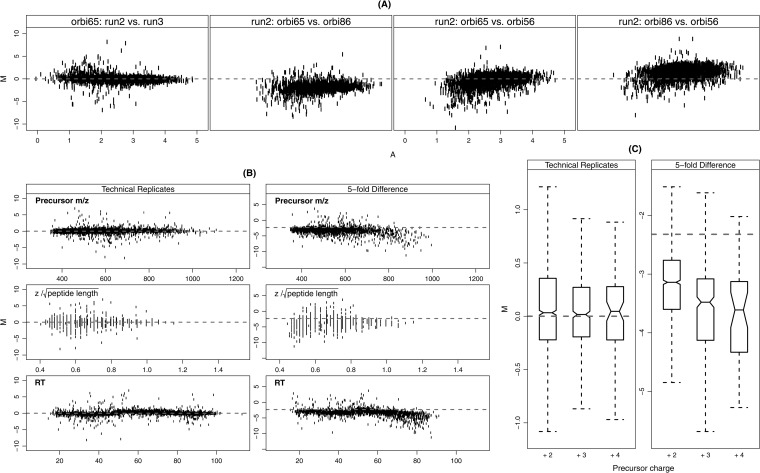
Fig. 2.
Systematic biases in ion current measurements measured by the relative intensities (M) and its relationship with selected variables. Relative intensity M is defined as the log2 ratio, M = log2 (IR1/IR2), where IR1 and IR2 are the intensities for the experimental run R1 and R2, respectively. The selected variables included the average abundance A = 0.5 [log10 (IR1) + log10 (IR2)], precursor m/z, , and retention time (RT). A, The relative intensity (M) versus abundance (A) within and across instruments. All runs are 300 ng/μl yeast samples (high). Panel 1: orbitrap 65 (2nd run) versus orbitrap 65 (3rd run); panel 2: orbitrap 65 (2nd run) versus orbitrap 86 (2nd run); panel 3: orbitrap 65 (2nd run) versus orbitrap 56 (2nd run); panel 4: orbitrap 86 (2nd run) versus orbitrap 56(2nd run). B, relative intensities (M) versus precursor m/z, , and retention time (RT). All runs are from Orbitrap 65 in Study 8. The technical replicate pair is the 2nd and the 3rd runs in the 300 ng/μl yeast samples (high). The fivefold difference pair is the 2nd run in the 300 ng/μl yeast sample (high) and the 2nd run in the 60 ng/μl yeast sample (low). The left column shows technical replicates pairs and the right column shows fivefold difference pairs. These plots illustrate that systematic bias is more significant between the high and low samples with fivefold difference. C, Boxplots of the relative intensities (M) under the three observed charge states (+2, +3, +4) on experimental runs from Orbitrap 65 in Study 8. The same experimental runs were used for the pairs of technical replicates and fivefold difference as in B. The boxplot bounds in the form of [IQR (median)] are as follows: technical replicates: +2 [0.58(0.03)], +3 [0.46(0.02)], +4 [0.49 (0.05)]; fivefold difference: +2 [0.84(−3.13)], +3 [1.05(−3.48)], +4 [1.20 (−3.61)]. The distribution similarity was tested by a two-sample Wilcoxon rank test. The distributions of M between the charge states in high versus low samples (fivefold difference) were statistically different (p value <0.001) with the exception of +3 compared with +4 (p value = 0.46). The distributions of M were not significantly different under different charge states for technical replicates (p value > 0.15).

