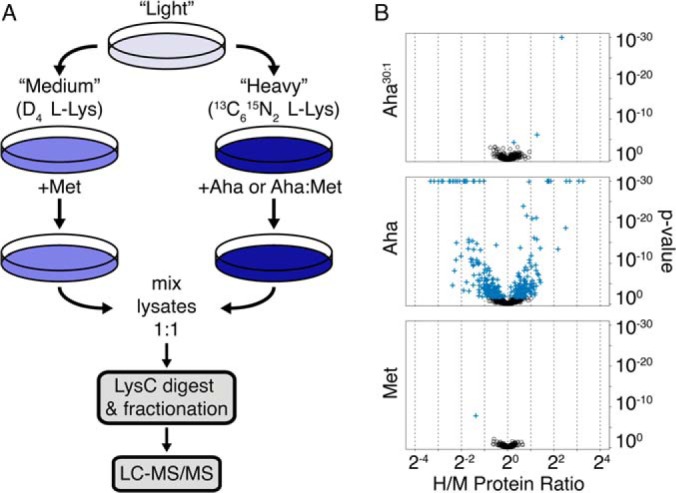
Fig. 1.

Quantifying the effects of Aha labeling on protein abundance in HeLa cell cultures. A, We used pSILAC to determine the effects of Aha labeling on protein abundance. Incorporation of “medium” and “heavy” isotope-labeled lysine allowed quantification of proteins from cultures treated with Aha or with mixtures of Aha and Met, relative to cultures treated with Met only. B, Global proteomic effects of Aha labeling in HeLa cell cultures. Quantified proteins are compared for cultures treated with Aha30:1 versus Met (top), Aha versus Met (middle), and Met versus Met (bottom). Proteins that show statistically significant differences from an H/M ratio of 1 (Benjamini-Hochberg FDR < 0.05) are marked by the blue cross symbol. H/M ratios greater than 1 indicate increased expression of proteins in the presence of Aha. Proteins with p values less than 10−30 were plotted at 10−30.
