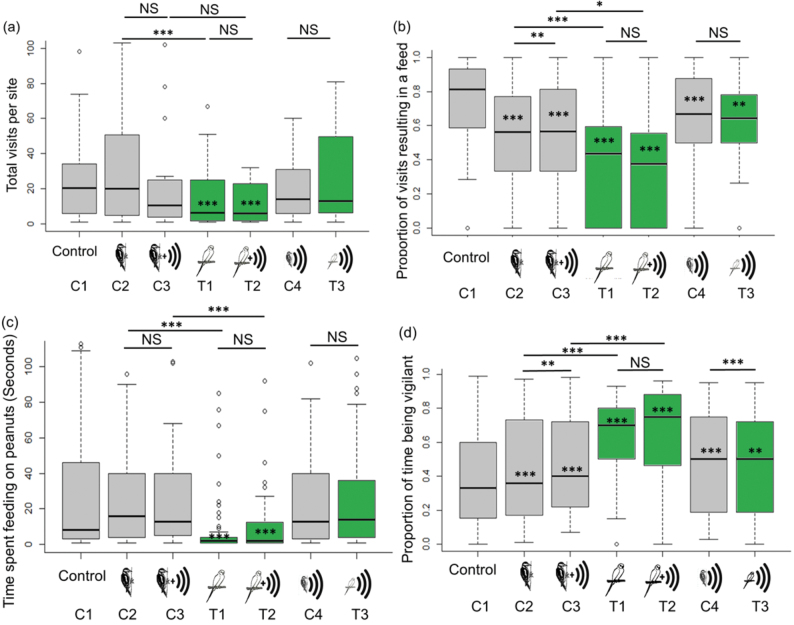
Figure 2.
Box and whisker plots for (a) number of visits (n = 6826), (b) proportion of visits resulting in a feeding event (n = 6826), (c) time spent feeding (seconds) on peanuts per feeding visit (n = 555), (d) vigilance (proportion of time spent not feeding [seconds] per feeding visit to peanuts) (n = 555), per treatment for sites inside the parakeet range (n = 30). Significant values within a box refer to the difference of the treatment from the control (C1), values outside a box and on a solid line refer to between treatments, (P values, ***P < 0.001, **P < 0.01, *P < 0.05). Gray boxes show controls and green boxes show treatments. C4 and T3 are both call only conditions and so are grouped together on the right of each panel to aid comparison.

