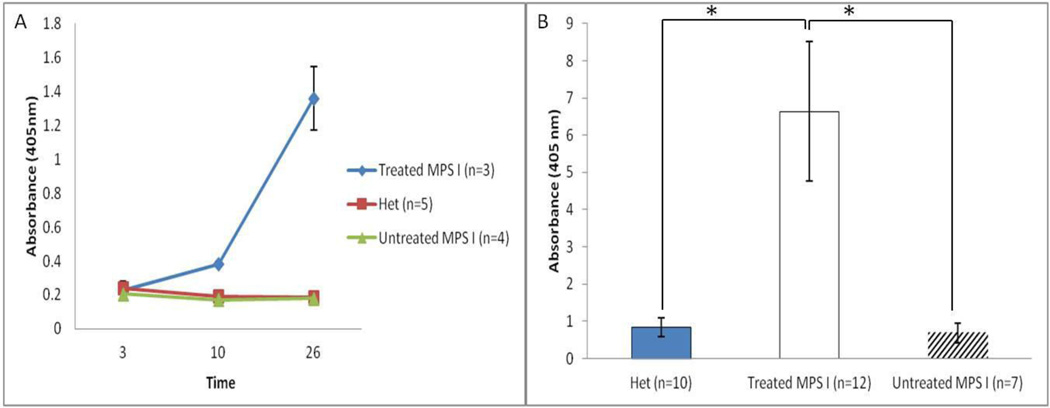
Figure 6. Anti-IDUA immune response detected after repeated high-dose ERT.
(A) The IDUA antibody levels were measured by ELISA in serum collected at various time-points (D3, D10, D26). X axis values mean time in days. The serum was tested at 1:50 dilution. (B) Serum from a total of 29 mice were collected right before sacrifice. The IDUA antibody levels were measured by ELISA. The serum was tested at 1:50 dilution. Data are mean ±standard error. * p<0.05.

