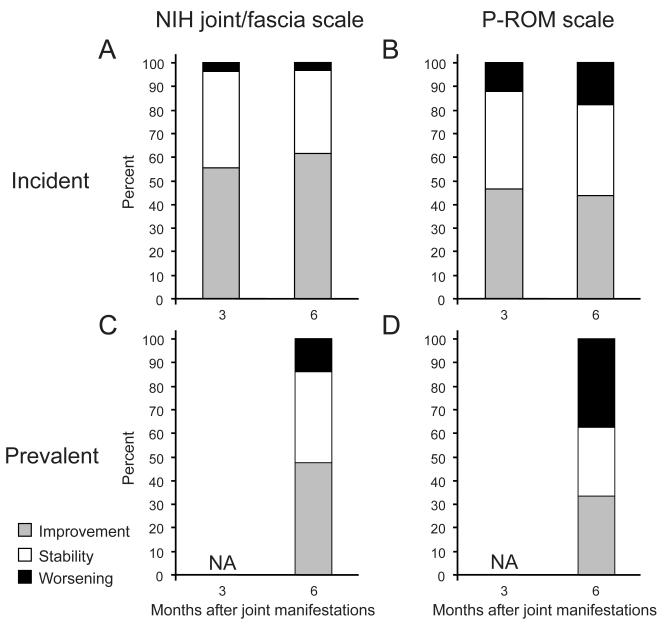
Figure 3.
Longitudinal response assessment according to the NIH joint/fascia scale and P-ROM total scale. Proportions of joint response across time after newly developed joint/fascia manifestations are shown in incident cases (A and B) and prevalent cases (C and D). Response was not assessed (NA) at 3 months in prevalent cases.

