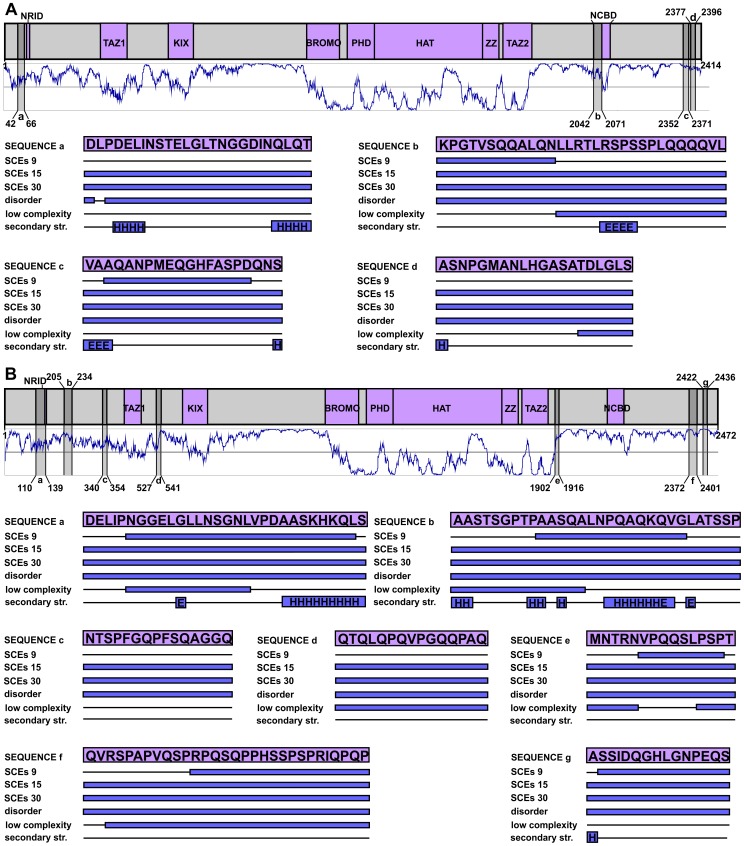
Figure 6. The SCEs of human CBP and p300 are differently distributed along their chains and avoid structured domains.
The human p300 (A) and CBP (B) are represented by grey bars at the top part of the panels, with their domains (boundaries adopted from a relevant review [19]) coloured purple and their regions corresponding to 15-codon resolution SCEs coloured with darker grey. Below the domain maps the predicted IUPred disorder patterns are shown in dark blue, where values above 0.5 are interpreted as disorder. The SCE-encoded regions are lettered from the N- towards the C-terminus in each protein and are reflected onto the prediction curves. Their structural properties are provided as in Figure 3.

