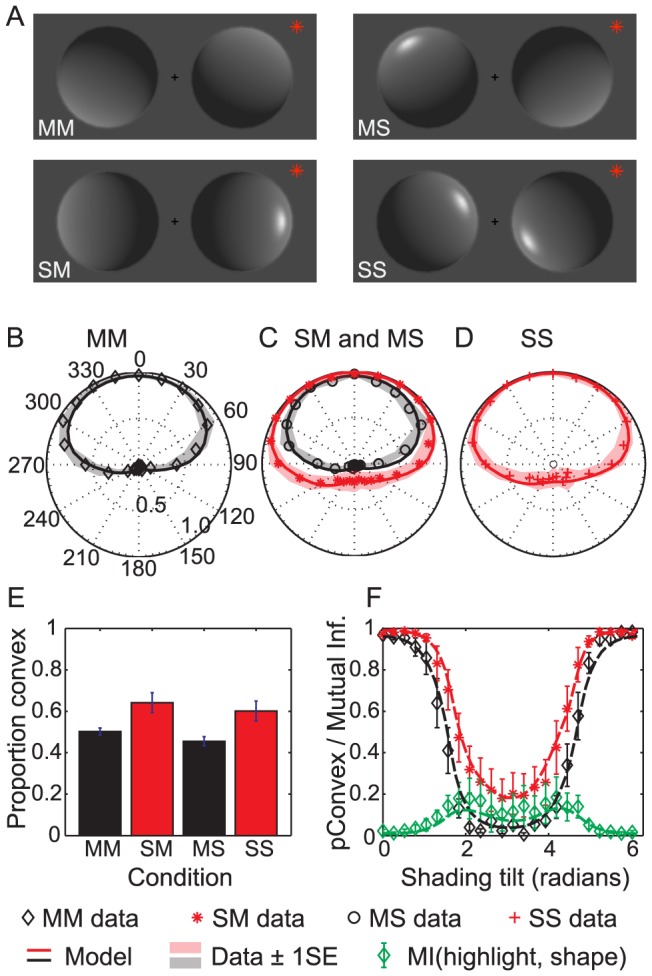
Figure 1. Experiment 1.

(a) Example stimuli from the four conditions of Experiment 1. The star indicates which object is the target to be judged. The two-letter label denotes whether the judged object and the non-judged distractor were matte (M) or shiny (S), respectively. (b–d) Proportion of objects perceived as convex, as a function of shading direction (in deg), averaged across observers. The solid lines indicate the fit of the model to the averaged data. Shaded region indicates  standard error (SEM) from the mean. (e) Proportion of convex responses for the four conditions, across observers. Error bars indicate ±1SEM across observers. (f) Perceived shape in the SM (red) and MM (black) conditions, and the corresponding mutual information (green diamonds) between the highlight and the perceived shape.
