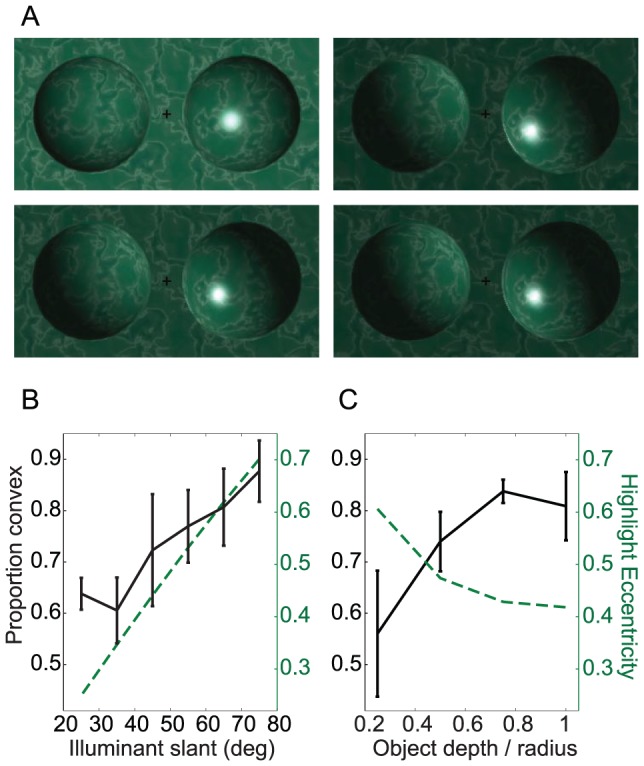
Figure 6. Experiment 3.

(a) 4 examples of the 336 stimulus configurations. In the left column, object depth is fixed (depth = ±0.75× half-width) but illuminant slant varies between the top (25°) and bottom (55°) images. In the right column, illuminant slant is fixed (65°) but object depth varies between the top (0.5) and bottom (1) images. Further stimulus examples can be found in Figure S2. (b) The effect of adding a highlight on the perception of surface curvature sign, as a function of illuminant slant, averaged across object depth. The dashed green lines in (b) and (c) give the highlight eccentricity, i.e. distance from the object's centre/object radius. (c) The highlight effect as a function of object depth, averaged across illuminant slant. The data are averaged across the four observers. Error bars indicate ±1SEM.
