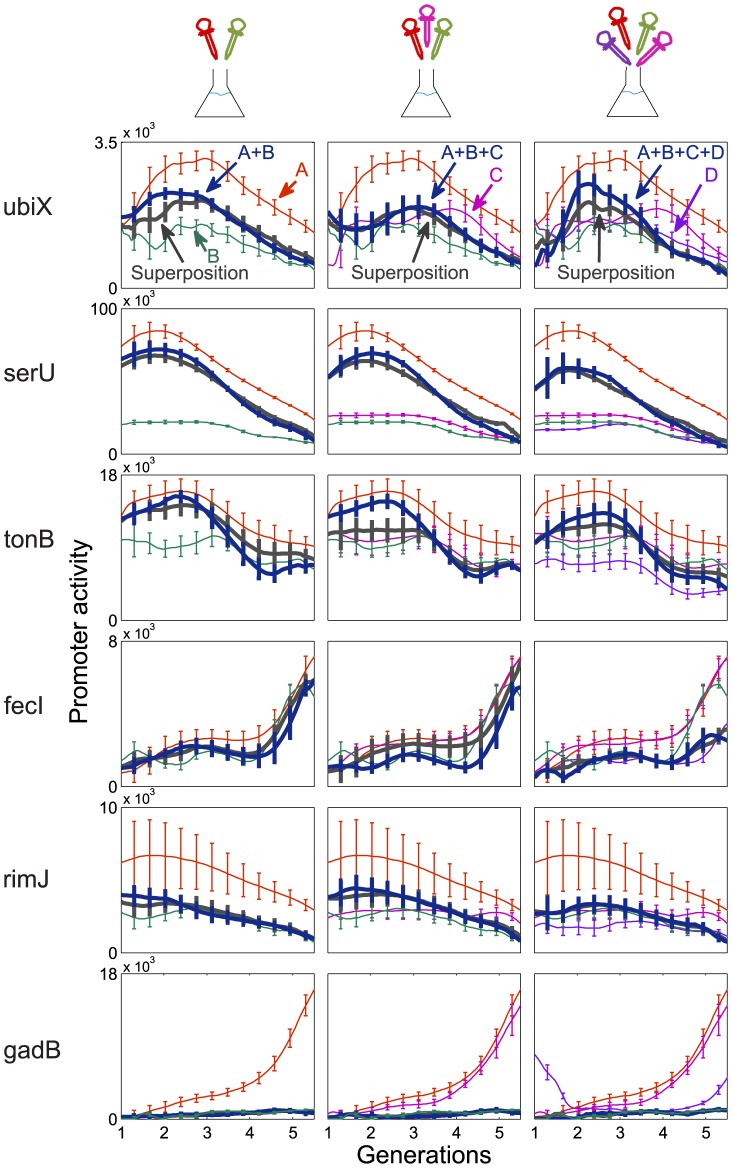
Figure 3. Promoter activity dynamics in combined conditions is diverse and well-described as a linear superposition of dynamics in individual conditions.
Six representative promoters are shown (each row belongs to one promoter. The Promoter name is indicated on the left). First column shows individual and pair conditions A+B, second column shows a triplet condition (A+B+C), and the third column a quadruplet (A+B+C+D). A = 0.05% casamino acids, B = 3% Ethanol, C = 10 µM H2O2, D = 300 mM NaCl, all added to M9+0.2% glucose defined medium. Dynamics in the combined condition (blue curve) are well-described by the best fit linear superposition of individual condition dynamics (black curve). Error bars are standard error between 4 independent experiments on different days.

