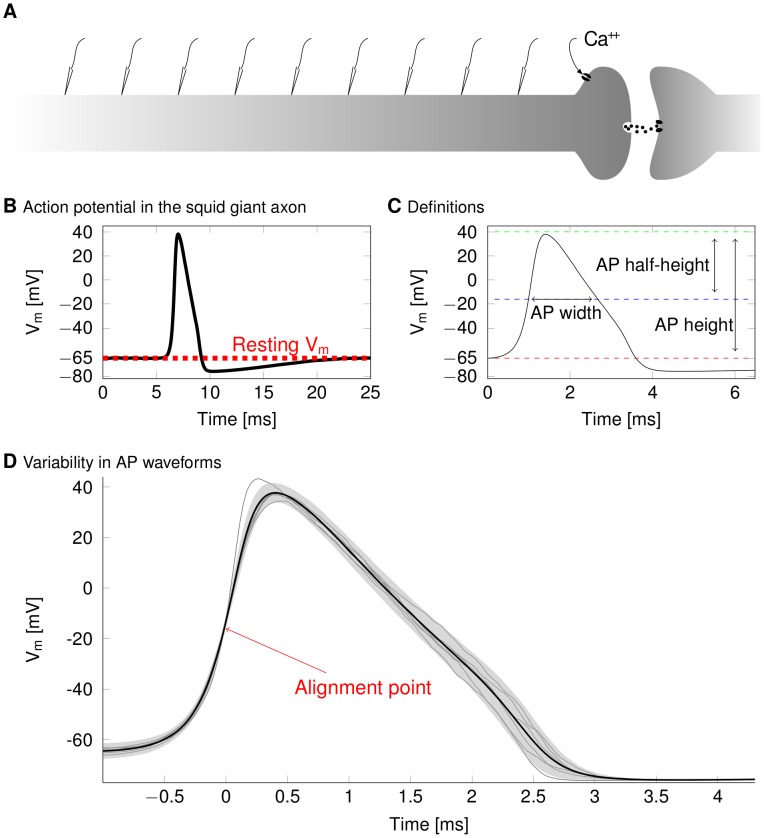
Figure 1. Definitions and methods.
(A) We record membrane potential and ionic currents at regularly placed points along the axon, and compare the (B) shape of the AP waveforms (black) and the resting membrane potential (dashed red). (C) Action potential features are determined individually for each AP. The amplitude of the AP is defined as the maximum membrane potential. The width is the delay between the crossings of the mid-height level. (D) AP shape fluctuations. Due to channel noise, APs triggered in an identical fashion will have different shapes across trials. Here APs in a 0.2 µm diameter axon from 5 trials out of 250 are superimposed. The point at which the membrane potential crossed the half-height line is used to align APs.

