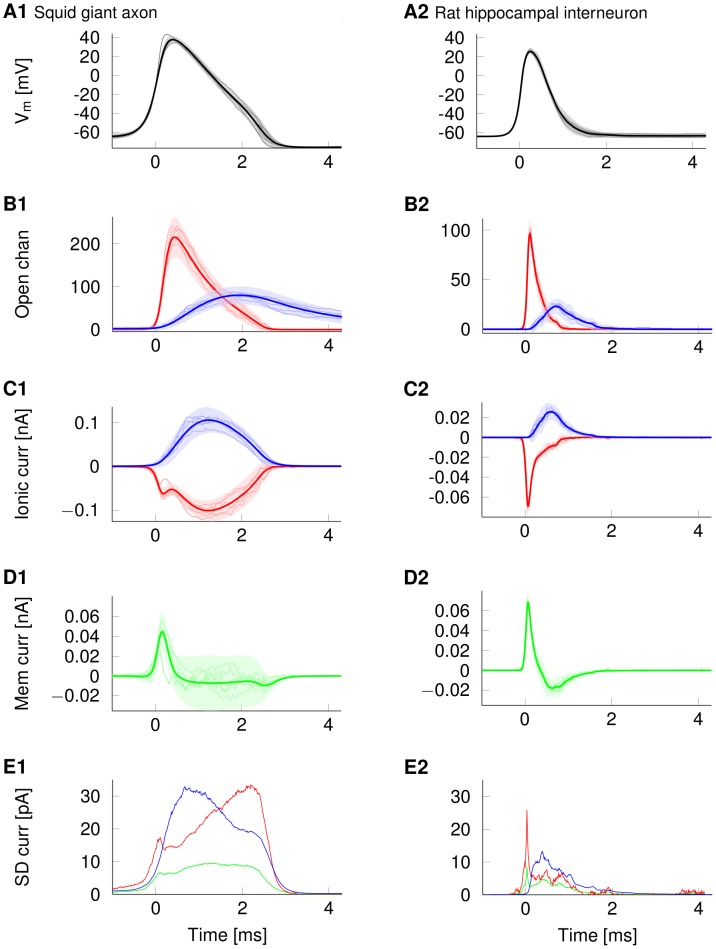
Figure 6. Ion channel and current fluctuations underlie waveform variability.
Ion channel and current fluctuations in an AP travelling along 0.2 µm diameter axons. All traces are aligned at the instant when the rising AP crosses half-peak. Data from the squid giant axon model is on the left, while the right plots show data from the rat hippocampal interneuron model. Shaded areas in A–D are the 3×SD envelope around the mean curve (dark curve). Light curves in A–D represent a sample of individual traces. (A) Membrane potential waveforms (B) Number of open Na+ (red) and K+ (blue) channels (C) Current flowing through Na+ (red) and K+ (blue) channels (D) Net membrane current (sum of Na+, K+ and leak) (E) SD of Na+ (red), K+ (blue) and net membrane (green) currents.

