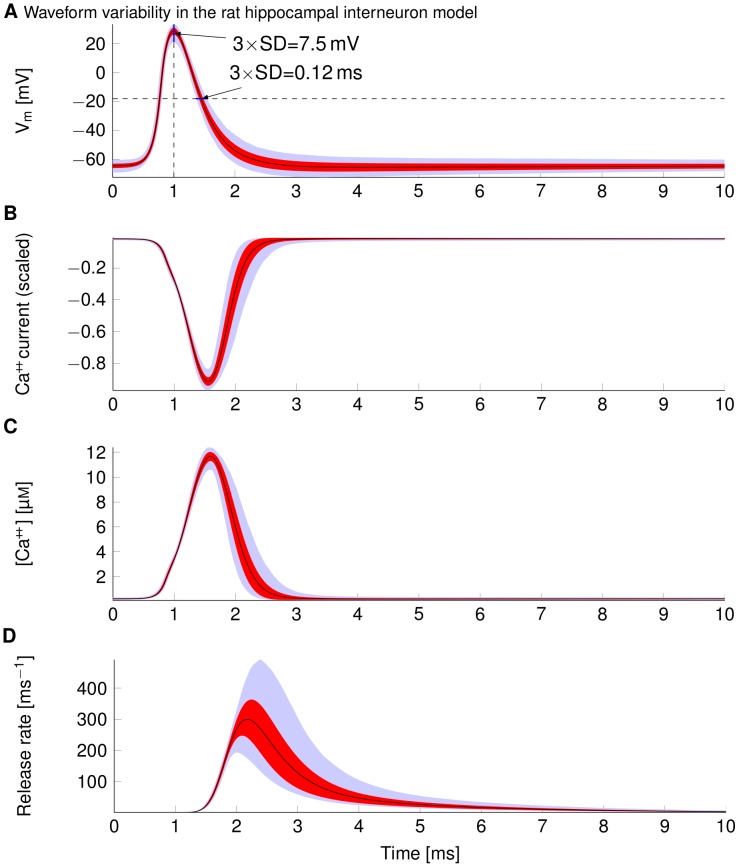
Figure 7. Variability in synaptic processes due to fluctuation in AP waveforms.
For all subfigures, the mean waveform is plotted in black, SD in red, and 1%–99% quantiles in light blue. (A) Waveforms of 2000 consecutive APs arriving at the terminal end of an axon of 0.2 µm diameter rat hippocampal interneuron model axon. (B) Ca++ current resulting from the integration of the above AP waveforms into a model of a pre-synaptic Ca++ channel (see text for details). The current is scaled because we are only interested in its waveform. (C) Intracellular Ca++ concentration for a large CNS synapse obtained by scaling the Ca++ current waveform, and lengthening it. (D) Time course of vesicle release rates computed for a model of a Calyx-of-Held type synapse (see text for details).

