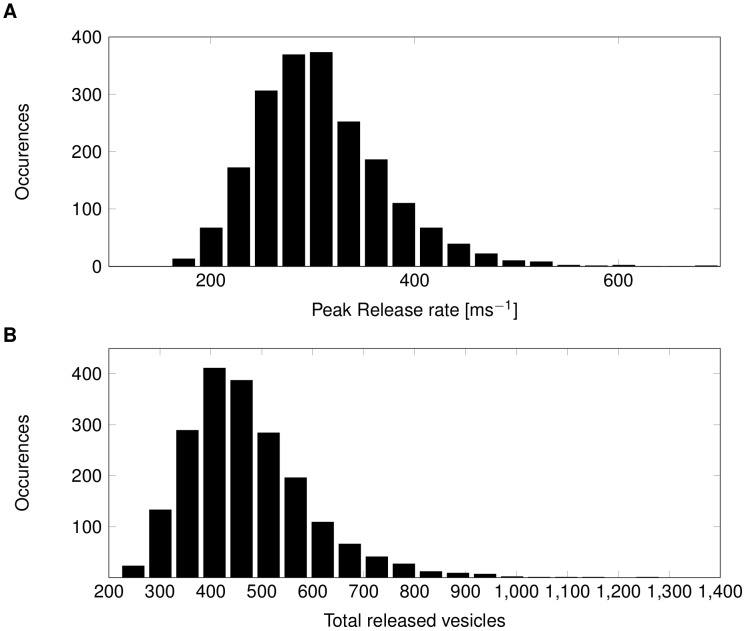
Figure 8. Calculated distribution of synaptic response variability.
(A) Distribution of peak vesicle release rate in a large CNS synapse resulting from variability in (N = 2000) AP waveforms (see text for details). (B) Distribution of the total number of released vesicles in a model of Calyx-of-Held type synapse for (N = 2000) AP waveforms.

