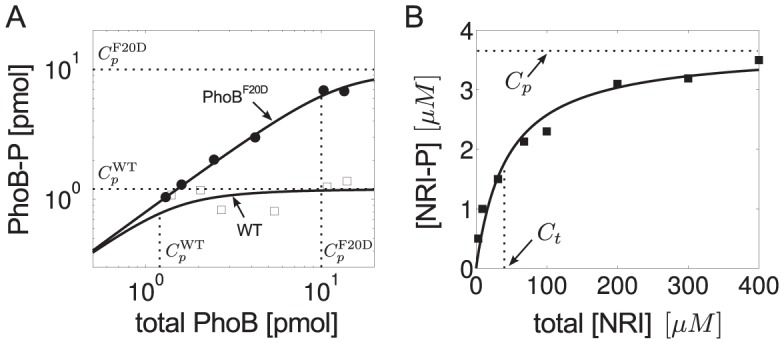
Figure 3. Experimental observations of concentration robustness in TCSs.

Comparison between predictions of the Batchelor-Goulian model and measurements in the PhoR/PhoB [26] and NRII/NRI systems [27]. (A) Symbols denote measurements of PhoB-P as a function of total PhoB amounts in the wild-type system (open squares) and in a  mutant strain (filled circles) (data were taken from Fig. 4C in Ref. [26]). Solid lines were calculated from Eq. (31) with
  pmol,
pmol,  pmol and
  pmol,
pmol,  pmol. Note that
  (dotted lines) determines both, the threshold amount of total PhoB beyond which PhoB-P becomes constant as well as the value of that constant, as expected from Eq. (2). (B) Symbols denote in vitro measurements of NRI-P as a function of total NRI (reproduced from Fig. 4A in Ref. [27]). Solid line represents the best fit of the data to Eq. (3) with
  and
and  , which indicates that the NRII/NRI system operates in the regime
  .
.
