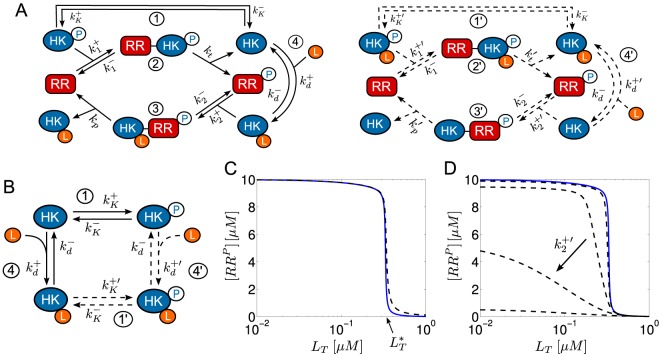
Figure 7. Impact of basal HK activities on the occurrence of ultrasensitivity.
(A) Extended Batchelor-Goulian model (cf. Fig. 2C) with basal HK activities (dashed lines): Autophosphorylation ( ), phosphotransfer (
 ) and phosphatase activity (
 ). (B) Scheme summarizing the allowed transitions between different enzyme states in the extended model with basal activities. It is assumed that ligand-binding occurs with reduced affinity (
 ) if the sensor kinase has already undergone autophosphorylation (
 ). To prevent cycle fluxes under steady state conditions it is required that
  . (C) Basal autokinase and phosphotransferase activities hardly affect the response curve. Even if the basal activities are identical to their full activities (
 ,
,  ,
,  ,
,  ) the transition point (
 ) remains almost the same and the steepness of the response curve is only slightly reduced (dashed curve). Basal phosphatase activity is assumed to be zero (
 ,
,  ). The blue curve is the same as that shown in Fig. 6A where both basal activities are zero. (D) In contrast, upon increasing basal phosphatase activity the steepness of the response curve (ultrasensitivity) becomes substantially reduced. Dashed lines correspond to
  and increasing values of
  for
for  (blue curve),
  ,
,  ,
,  ,
,  . Basal autokinase and phosphotransferase activities are assumed to be zero (
 ). Other parameter values are the same as for the blue curve in Fig. 6A. Simulations were done using Eqs. (64).

