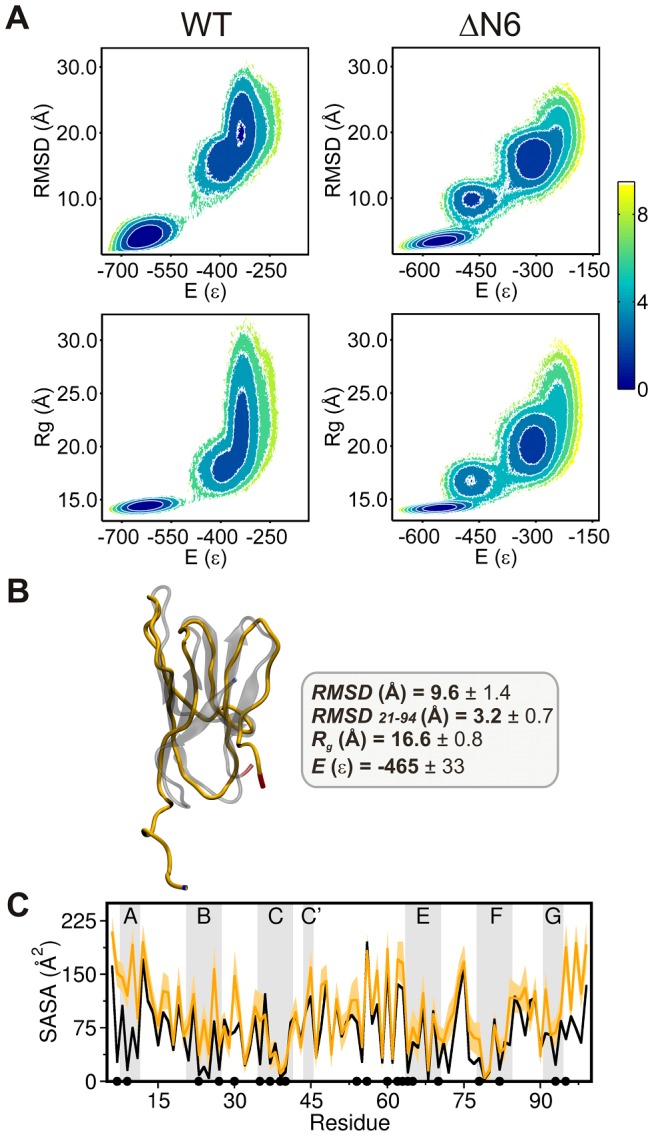
Figure 2. Characterization of the intermediate state populated by ΔN6.

(A) Free energy surfaces for the Hβ2m and ΔN6 variant, showing an intermediate basin for the truncated mutant. The location of the free energy minima shows that the intermediate's energy, E, represents 83% of the native energy and its radius of gyration, R g, is 18% larger than that of the native state. The root-mean-square deviation, RMSD, measured with reference to the Hβ2m native structure is ∼10 Å. (B) Structure of a representative conformation (i.e. the conformation that is the closest to the cluster centroid) populated by the ΔN6 intermediate (which was isolated with structural clustering), and mean values (averaged over the intermediate's ensemble) of selected properties. The first Cα RMSD is measured for the whole chain taking as a reference the native structure (PDB ID: 2XKU). The second Cα RMSD21–94 was evaluated over the core region comprising residues 21 to 94 (i.e. strands B–G and connecting loops), after fitting to the core region of the native structure. This property highlights the conservation of this region in the intermediate species. (C) SASA values per residue were obtained as averages over the ensemble of intermediate conformations identified in the clustering and compared with those of the Hβ2m native structure (black line). The SASA values depicted were obtained with GROMACS v4.5.5 [80]–[82]. The dots represent the 21 hydrophobic core amino acids: Leu7, Val9, Leu23, Val27, Phe30, Ile35, Val37, Leu39, Leu40, Leu54, Phe56, Trp60, Phe62, Tyr63, Leu64, Leu65, Phe70, Tyr78, Val82, Val93, and Trp95. In the intermediate species 62% of the hydrophobic core residues have a noticeable increase in SASA.
