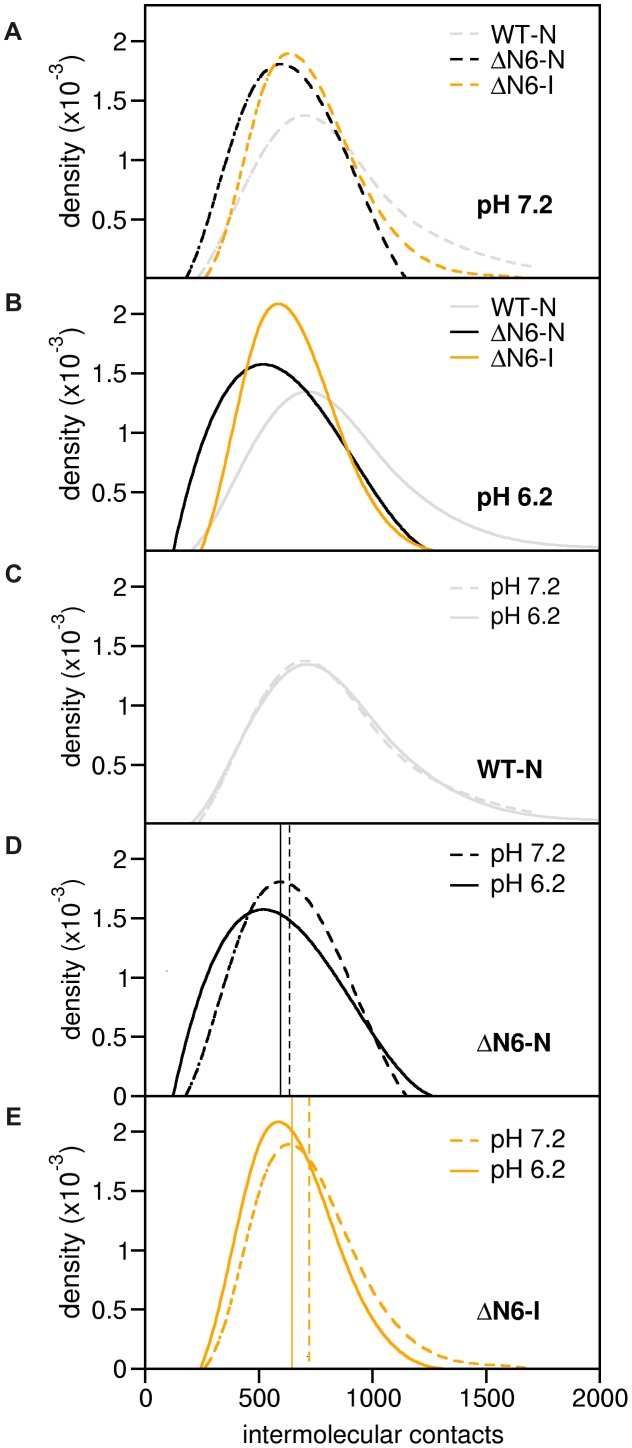
Figure 3. Intermolecular contact formation at pH 7.2 and 6.2.
Density histograms for the number of intermolecular contacts established in dimers of WT-N, ΔN6-N and ΔN6-I at pH 7.2 (A) and pH 6.2 (B). To facilitate the comparison, the DHs for pH 7.2 and for pH 6.2 for WT-N (C), ΔN6-N (D), and ΔN6-I (E) are also shown. The vertical lines in the plots indicate the mean of the distributions.

