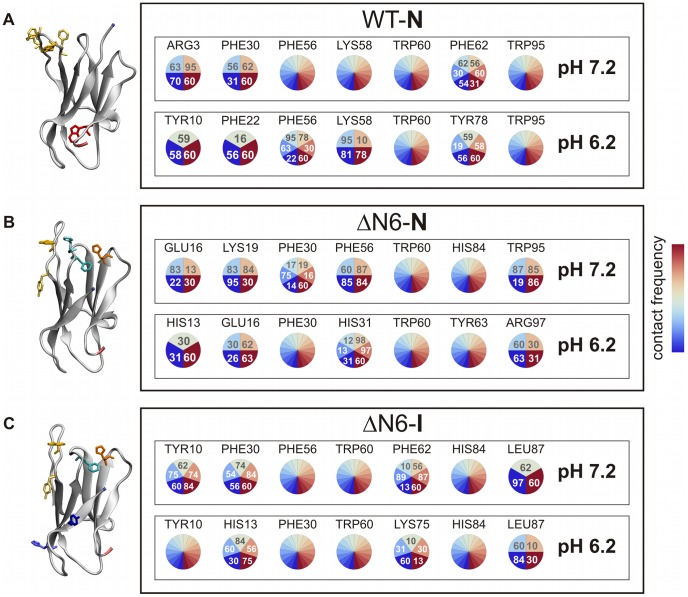
Figure 6. Interaction pies for the dimerization hot spots.
Detailed analysis of the interaction partners of the dimerization hot spots (i.e. amino acids involved in the higher number of interactions within the set of the 50 most frequent intermolecular contacts). The numbers within each circle identify the residue (via its number along the protein sequence) that interacts with a putative hot spot, while the associated color represents the number of contacts found between the two-residues. The color code ranges from blue (i.e., small number of interactions) to red (i.e., large number of interactions). Whenever a hot-spot candidate has many interaction partners (more than six) a rainbow-like pie is used, and the residues are not explicitly identified. The hot-spots residues involved in the higher number of intermolecular interactions are mapped into the corresponding native structure (left column), and colored according to the color code adopted in Figure 1 .

