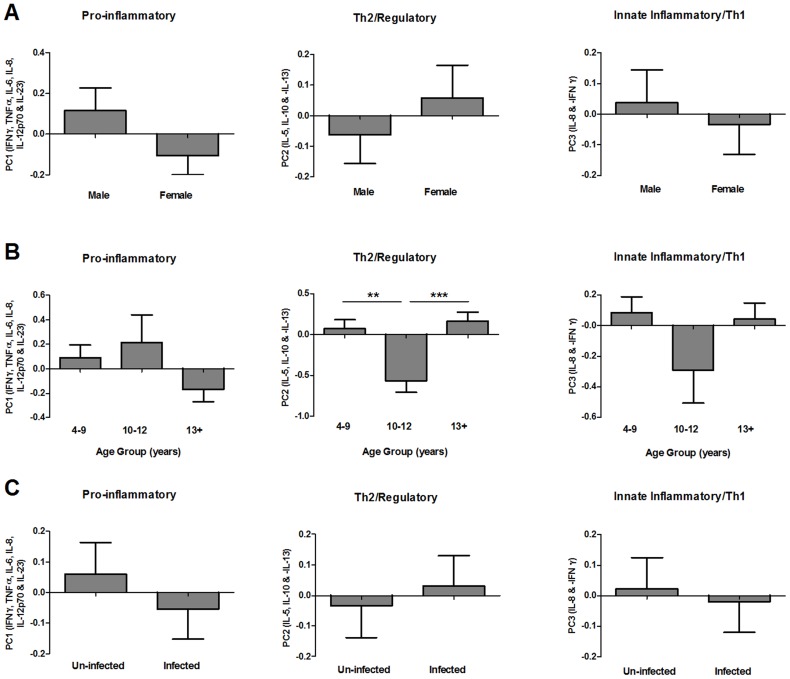
Figure 2. Distribution of pre-treatment GST-specific cytokine profiles by gender, age group and S. haematobium infection status.
Mean principal component regression factor scores for pro-inflammatory (PC1), Th2/regulatory (PC2) and innate inflammatory/Th1 (PC3) cytokine profiles sub-divided by gender (A), age group (B) and schistosome infection status (C; un-infected = egg negative in all urine samples, infected = egg positive in one or more urine samples). Where ANOVA (sequential sums of squares accounting for variation in gender and age group before infection status) indicated that a factor significantly contributed to variation in cytokine profiles, pair-wise comparisons of PC scores were conducted via post-hoc Fisher's least significant difference tests between the 3 age groups (n = 195);**p<0.01, ***p<0.001. Error bars: standard error of the mean.

