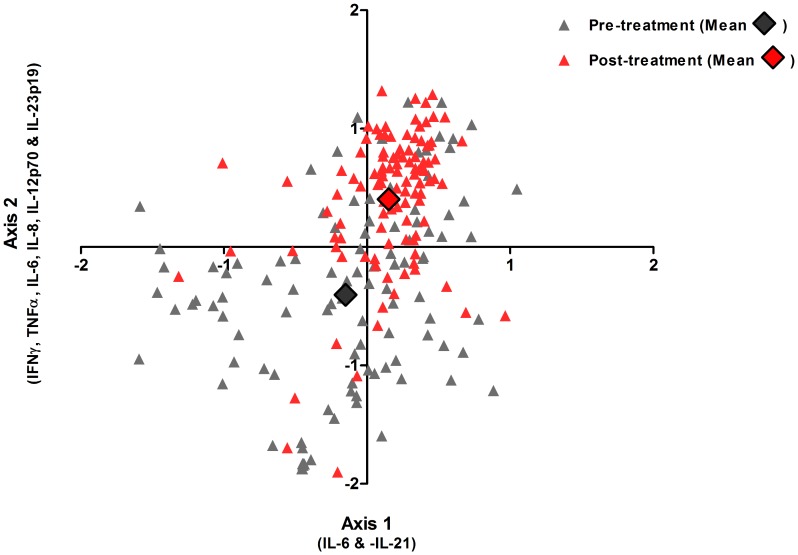
Figure 3. Relative similarity and dissimilarity in patterns of GST-specific cytokine responses before and 6 weeks after praziquantel treatment.
NMS ordination plot showing Sorensen Bray-Curtis distance scores (an indicator of how a participant's combination of 13 GST-specific cytokine responses rank relative to those of all other participants) for all participants plotted before (grey triangles) and 6 weeks after (red triangles) praziquantel treatment. Axis 1 and 2 are spatial meaning that participants positioned close together have similar patterns of cytokine responses to GST and those positioned far apart have dissimilar patterns of cytokine responses to GST. The individual cytokines that most closely correlate with each axis are indicated. Bold diamonds represent the mean pre- (grey) and post-treatment (red) scores for the study cohort (n = 107).

