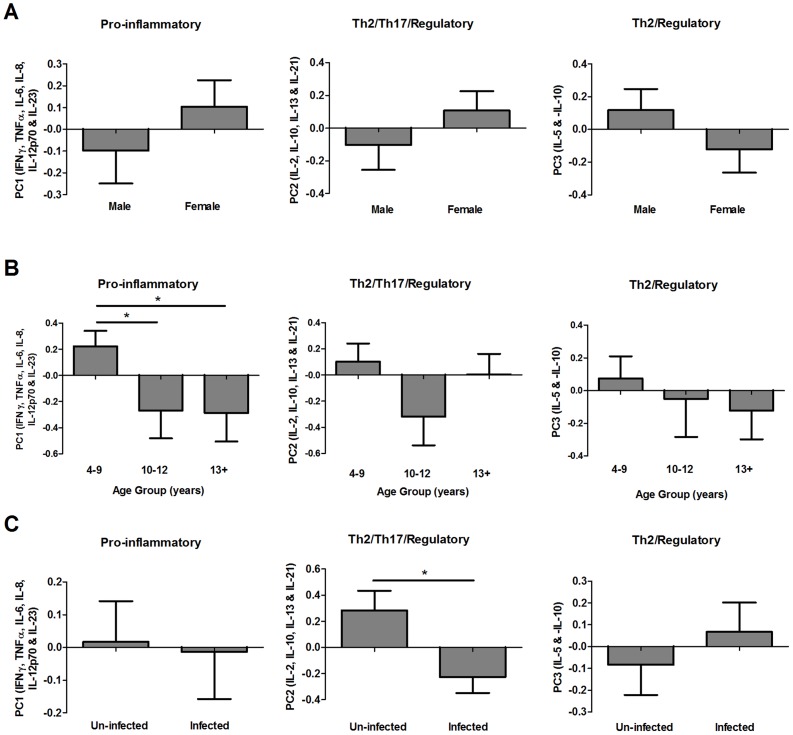
Figure 4. Distribution of post-treatment GST-specific cytokine profiles by gender, age group and S. haematobium infection status.
Mean post-treatment principal component regression factor scores for cytokine profiles associated with pro-inflammatory (post-treatment PC1), Th2/Th17/regulatory (post-treatment PC2) and Th2/regulatory (post-treatment PC3) responses sub-divided by gender (A), age group (B) and schistosome infection status at baseline (C; un-infected = egg negative in all urine samples, infected = egg positive in one or more urine samples). Error bars: standard error of the mean. Where ANOVA (sequential sums of squares accounting for variation in gender and age group before infection status) analysis indicated that age group contributed to variation in cytokine profiles, pair-wise comparisons of PC scores were conducted via post-hoc Fisher's least significant difference tests between the 3 age groups (n = 107);*p<0.05.

