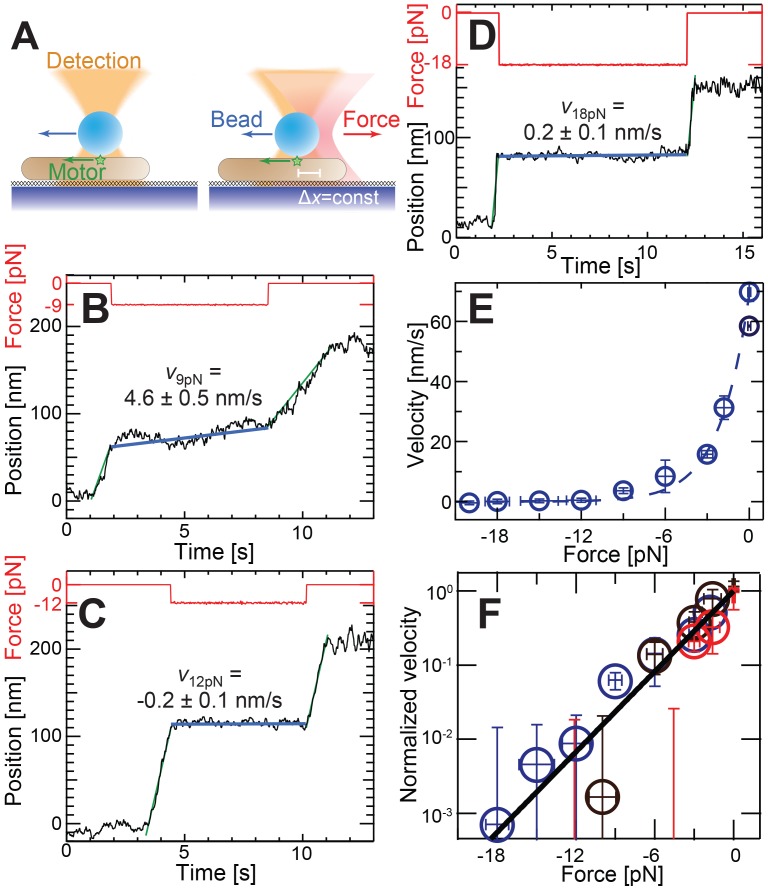
Figure 5. Bead/molecular motor motility behavior under optical trap loading.
(A) A gliding motor moves a bead along the cell axis. Past a preset threshold movement, the shutter in front of the optical trap is opened, pulling the bead in the direction opposite to the motor by the preset force, resulting in a slowing of bead movement. (B–D) For opposing forces of 12 pN or greater (18 pN) bead movement has stopped and for lower forces (9 pN) bead movement is slowed down but not completely stopped. Here an experiment is associated with the activity of a single motor only if the bead moves before and after trapping with the same direction and speed (green lines). A linear fit to the position versus time during force application provides the velocity (blue lines). (E) Bead velocity decreases exponentially with force but never becomes negative consistent with an elastic coupling and inconsistent with a viscous coupling between the bead and motor. The dashed lines are an exponential fit to the data. Error bars represent the standard error of the mean across trials (>6 trials per data point). (F) Force-velocity curves normalized by unloaded velocity corresponding to different nigericin concentrations (blue circles – 0 µM, brown circles – 10 µM, red circles – 20 µM; see Fig. S6 for individual curves) collapse on to a single line on a semi-log plot.

