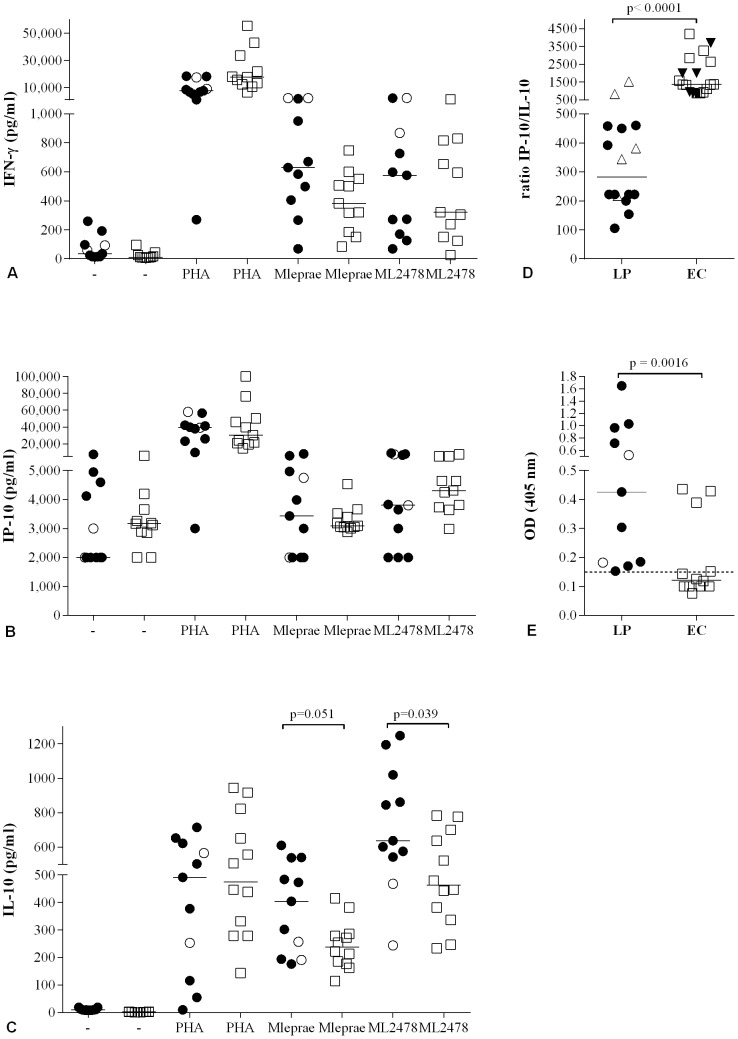
Figure 1. Combined cytokine profiles in response to M. leprae.
Production of IFN-γ (A), IP-10 (B) and IL-10 (C) determined by ELISA, in response to medium (-), PHA, M. leprae WCS or the M. leprae-unique protein ML2478 in 24 h WBA for Ethiopian leprosy patients (n = 11: 2 BT (○) and 9 BL (•), and healthy endemic controls (EC; n = 12; □). For comparison between BT and BL, significant differences were found for M. leprae WCS (Mlep) induced IFN-γ responses (p = 0.036) and ML2478 induced IL-10 responses (p = 0.035). (D): IP-10/IL-10 ratios are depicted for unstimulated samples after 24 h {LP (•) and EC (□)} or after 1 h WBA {LP (▵) and EC (▾)}. (E): Anti-PGL-I antibodies for BL (○) and BT (•) patients were detected by ELISA using natural disaccharide of PGL-I linked to HSA [31] (ND-O-HSA). Optical density (OD450) readings were performed using 1∶800 serum dilutions. Median values per group are indicated by horizontal lines. The cut-off for positivity is indicated by the dashed horizontal line.

