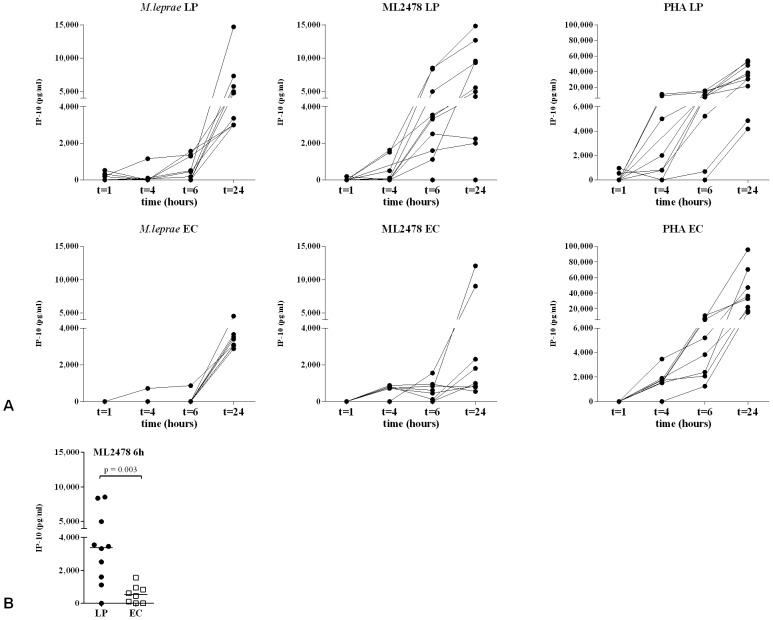
Figure 2. Kinetics of IP-10 production in WBA.
(A): IP-10 concentrations produced in stimulated whole blood cultures of leprosy patients (upper panel; LP; n = 10: 5 BL (Ethiopia); 2 BT (Ethiopia); 3 BT (The Netherlands) and healthy endemic controls (lower panel; EC, n = 8) in response to M. leprae WCS (left panel; 10 µg/ml), M. leprae unique protein ML2478 (middle panel; 10 µg/ml) and PHA (right panel; 1 µg/ml). IP-10 concentrations were determined by ELISA after 1 h, 4 h, 6 h and 24 h antigen stimulation. Values on the y-axis are concentrations corrected for background values. (B): Comparison of IP-10 concentrations determined by ELISA after 6 h stimulation with ML2478 (10 µg/ml) of whole blood samples.

