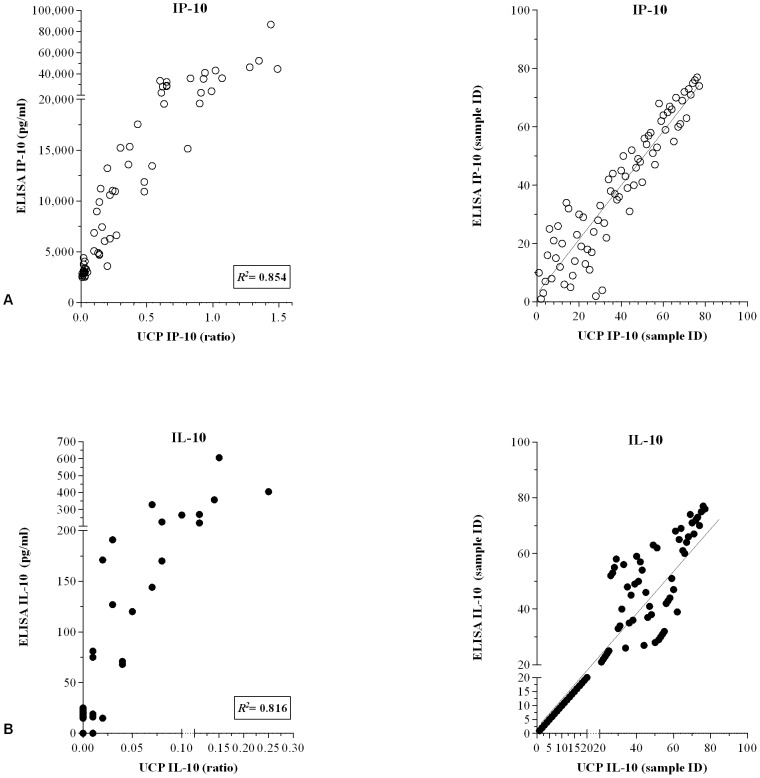
Figure 3. Correlation between ELISAs and UCP-LFAs.
Levels of IP-10 (A) and IL-10 (B) in 24 h whole blood samples of 77 M. leprae (antigen), LPS and PHA stimulated WBA samples of Dutch healthy controls were simultaneously determined by ELISAs and wet-format UCP-LFAs. Left panels: results for ELISAs are indicated in pg/ml (ELISA) or as the ratio of the relative fluorescence units (RFUs) measured at Test and Flow-Control lines (UCP-LFA). R2 equals the square of the Pearson correlation coefficient. Right panels: Spearman ranking.

