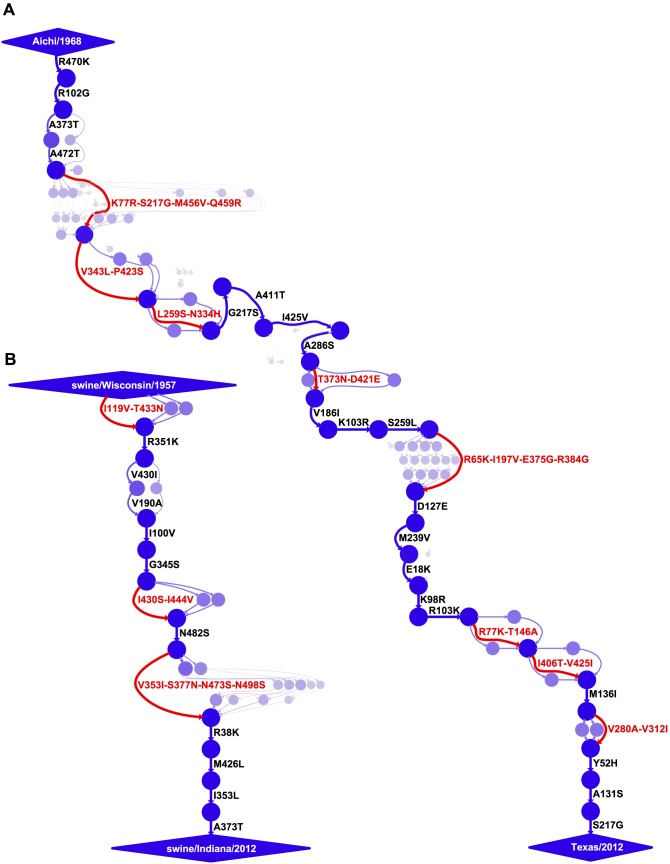
Figure 2. Evolutionary trajectories of human and swine NP.
Mutational paths through protein sequence space along (A) the evolutionary trajectory from the human strain Aichi/1968 to Texas/2012 and (B) the evolutionary trajectory from swine/Wisconsin/1957 to swine/Indiana/2012. In the mutational paths, circles represent unique protein sequences, with areas and intensities proportional to the posterior probability that the sequence was part of the trajectory. Blue lines with black labels represent single mutations between sequences, with thicknesses and intensities proportional to the posterior probability that the mutational connection was part of the trajectory. When there is no single high-probability one-mutation connection between sequences, red lines and labels indicate that several mutations fixed in an unknown order. See http://jbloom.github.io/mutpath/example_influenza_NP_1918_Descended.html for code, input data, and detailed documentation. The trajectory in (A) is highly similar to that reported in [34], but is slightly longer and contains sequences from prior to 1968. The inclusion of these pre-1968 sequences is the reason why the first portion of the trajectory is slightly better resolved than that in [34].

