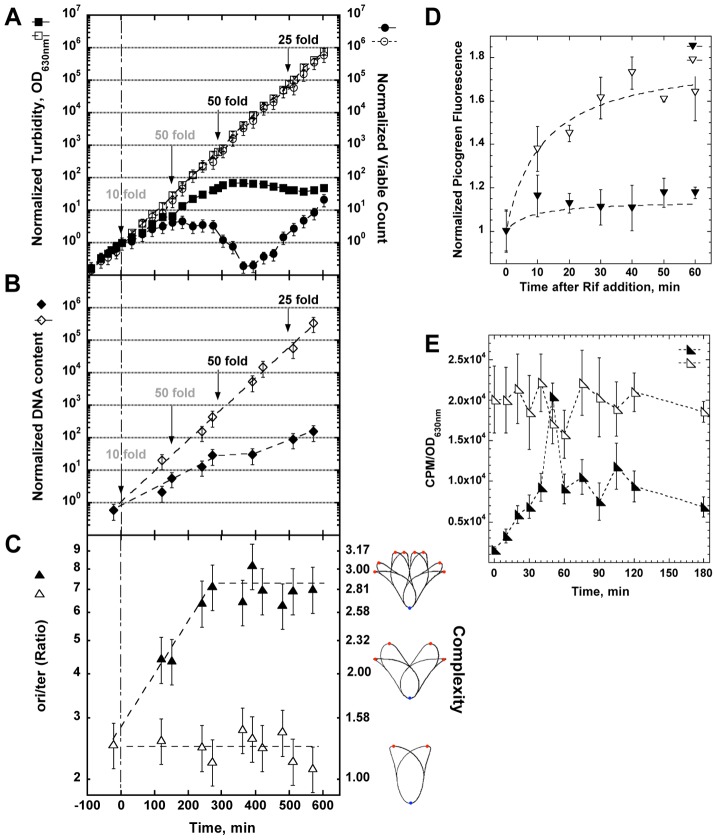
Figure 3. Physiological changes in optA1 gpt strain during growth in medium without hypoxanthine (Hx).
(A) Cultures of the optA1 gpt strain were grown exponentially in the presence of hypoxanthine (Hx) (50 µg/ml). At time 0 (OD630 nm = 0.1), two aliquots were filtered and diluted 10-fold into identical fresh, prewarmed medium with or without Hx. During subsequent growth, cells were kept in active growth stage by dilutions, when necessary, to keep the OD630 nm below 0.2 at all times. Such dilutions are indicated by arrows. Dilutions applied to both cultures are in gray; those applied to only the +Hx culture are in black. All OD630 nm and viable count values displayed on the y-axes are normalized to the initial value at t0 and adjusted for the applied dilutions. The values for OD630 nm (turbidity) and viable count after the initial 10-fold dilution (at time zero) were chosen as reference point for all comparisons (100 = 1). The actual values at this time point were 0.01 for the OD630 nm and 2.5×10⁶ cells per ml for the viable count. Turbidity (OD630 nm) is represented by squares, viable count by circles. Open symbols represent growth with Hx; closed symbols, growth without Hx. (B) DNA content of optA1 gpt cells growing with and without Hx. Details as in (A) above. The DNA content value for the zero time point is 60 ng/ml. Open symbols, growth with Hx; closed symbols, growth without hypoxanthine. (C) Determination of ori/ter ratio of optA1 gpt strain (left scale) or translated into complexity  (right scale). Open triangles, growth with Hx; closed triangles, growth without Hx. The illustrations to the right of the complexity scale are adapted from the Cell Cycle Simulation Program (http://simon.bio.uva.nl/cellcycle/); the illustrations demonstrate different levels of nucleoid structure (i.e., chromosomes with 1, 2 or 3 fork positions), which are modeled to progressively appear during purineless growth. The red dots represent the chromosomal replication origin (oriC). (D) Measurement of run-out DNA synthesis during rifampicin treatment of cultures containing Hx (open triangles) or during dGTP starvation (closed triangles). Hx was removed at time zero. (E) Measurement of DNA synthesis rate. optA1 gpt cultures either containing hypoxanthine (open triangles) or starved for hypoxanthine (closed triangles) for different times were subjected to a 3-min pulse with [methyl-3H]-thymidine (see Materials and Methods). Counts per minute (CPM) were normalized relative to turbidity of the corresponding culture, as this parameter approximately reflects the amount of DNA (compare A and B). For all panels (A through E) standard deviations (error bars) were calculated from three experiments.

