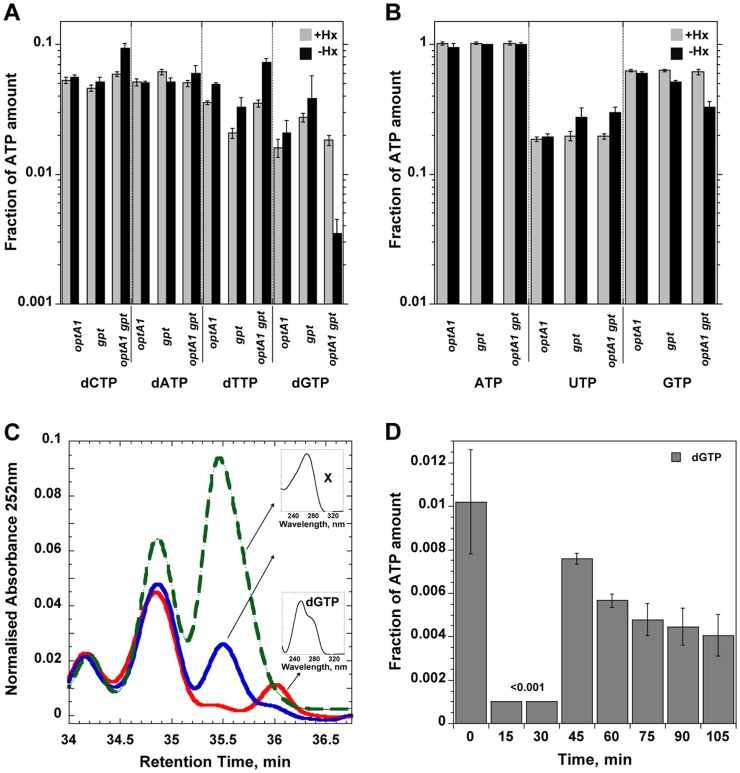
Figure 4. Nucleotide pool effects in Hx-starved strains.
Shown are (A) dNTP and (B) NTP pools in strains grown with (grey) or without (black) hypoxanthine (Hx) at two hours after withdrawal of Hx in the indicated strains. Nucleotide amounts were normalized relative to the ATP peak as in [38]. The amount of ATP calculated as ATP/(OD630 nm×sample volume) was largely unchanged among each of the strains. CTP could not be quantitated in these experiments. Standard deviations (error bars) were calculated from three experiments. (C) Chromatogram showing disappearance of dGTP during Hx starvation of the optA1 gpt strain. The red line represents growth in presence of Hx; the blue line and green lines correspond to 2 and 4 h of Hx starvation, respectively. The small inserts show the absorption spectra of dGTP and the unknown substance (X) that appeared during the starvation and interfered with quantitation of the dGTP at later time points. (D) Time course for dGTP pool changes in hypoxanthine-starved optA1 gpt strain. Cells were grown in hypoxanthine-containing medium (+Hx). At t = 0, hypoxanthine was withdrawn, and samples were withdrawn at indicated times. The HPLC analysis protocol was modified to provide for improved resolution of the dGTP peak (see Materials and Methods). The dGTP level at 15 and 30 min of starvation was below the detectable limit of the method (0.001).

