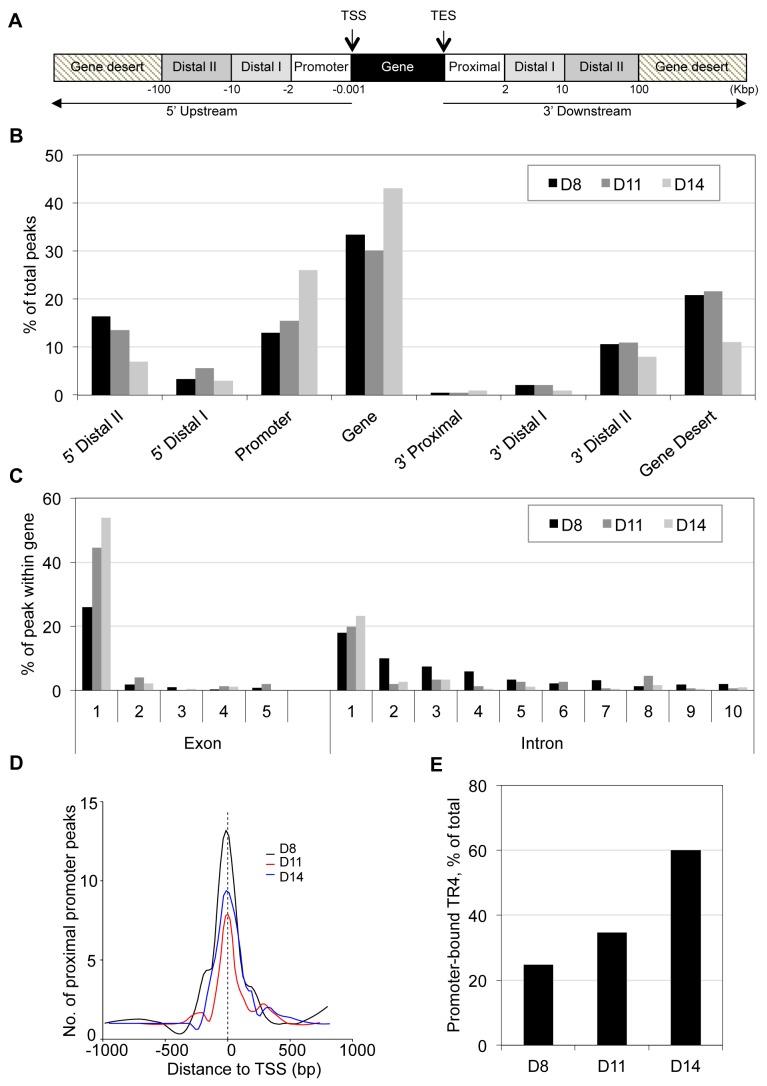
Figure 1. Genome-wide distribution of TR4 binding sites in differentiating human erythroid cells.
(A) TR4 peak assignment is based on the distance from the peak center to the nearest transcription start site (TSS) of RefSeq genes. Once a peak has been assigned to the nearest gene, its location is classified into: within the gene (from TSS to transcription end site (TES)), 5′ upstream or 3′ downstream. Peaks in the 5′ upstream regions are further grouped into: promoter (from −0.001 to −2 Kbp), 5′ distal I (from −2 to −10 Kbp 5′) and 5′ distal II (from −10 to −100 Kbp 5′), and peaks located 3′ of the TES are grouped as 3′ proximal (from TES to 2 Kbp after TES), 3′ distal I (from 2 to 10 Kbp after TES) and 3′ distal II (from 10 to 100 Kbp 3′ to TES). Peaks >100 Kbp from TSS or TES are reported here to fall within gene deserts. (B) Distribution of TR4 binding peaks across the genome in day 8 (D8), 11 (D11) and 14 (D14) erythroid cells. (C) TR4 binding peaks that fall within genes are mapped within those gene exons and introns. Here, only the first 5 exons and the first 10 introns are shown. (D) Histogram illustrating the distribution of peaks in a window ±1 Kbp from the TSS (proximal promoter) at D8, D11 and D14 of erythroid differentiation. Peaks were combined into 15 bp bins. (E) Percentage of peaks that mapped to proximal promoter in D8, D11 and D14 differentiated erythroid cells.

