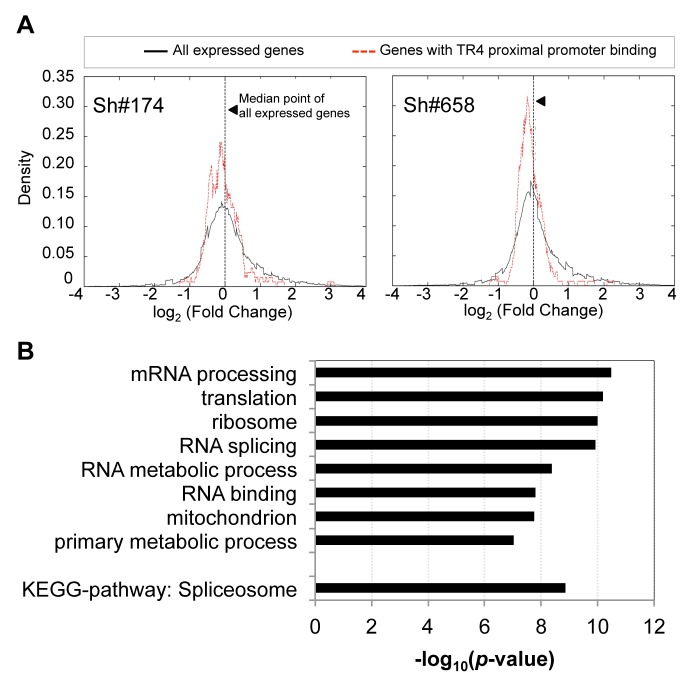
Figure 3. The expression of genes with TR4 bound at proximal promoter is reduced after TR4 depletion.
(A) The distribution of the expression fold change between genes with TR4 bound in the proximal promoter region (dashed red lines) vs. that of all expressed genes (solid black line) after TR4 depletion by either lentivirus sh#174 (right panel) or lentivirus sh#658 (left panel), where positive values indicate an increase in expression after TR4 depletion. (B) Genes with TR4 bound at the proximal promoter are enriched in basic biological functions.

