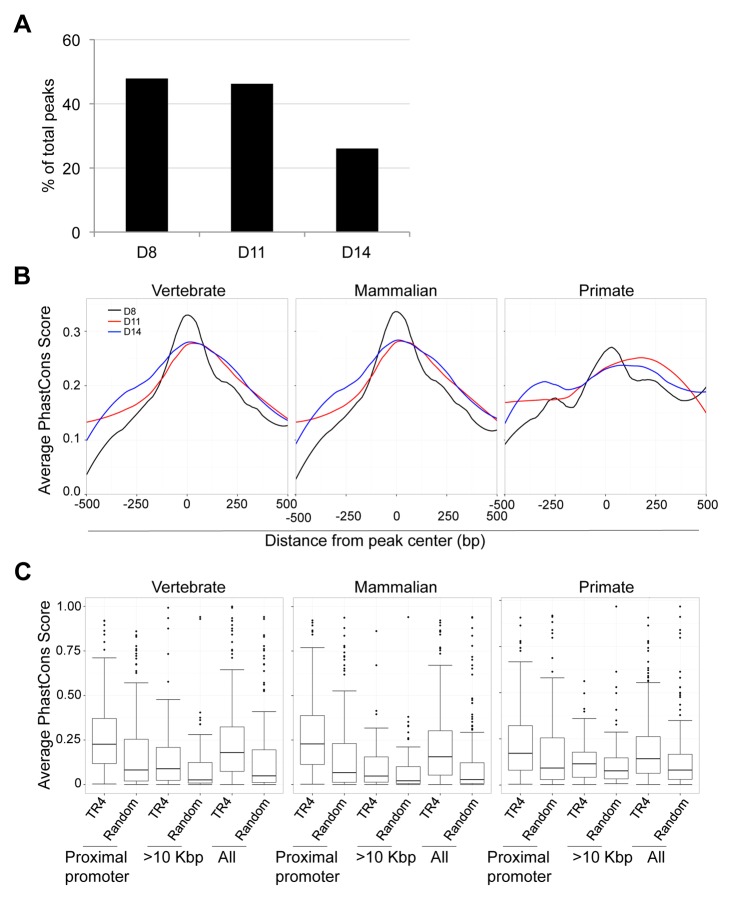
Figure 7. Sequence conservation among TR4 peaks.
(A) The percentage of peaks located >10 Kbp from the nearest RefSeq genes decreased from D8 to D14 of differentiation. (B) For peaks located at the proximal promoter, the average PhastCons score of each nucleotide within a peak (500 bp from peak center) across vertebrate, mammalian or primate species are graphed. The center of each peak is defined as “0”. (C) Comparison of the average PhastCons scores of peak sequences and random control sequences in the TR4 peaks located at proximal promoter, >10 Kbp from genes or in all identified peaks at D14 differentiation.

