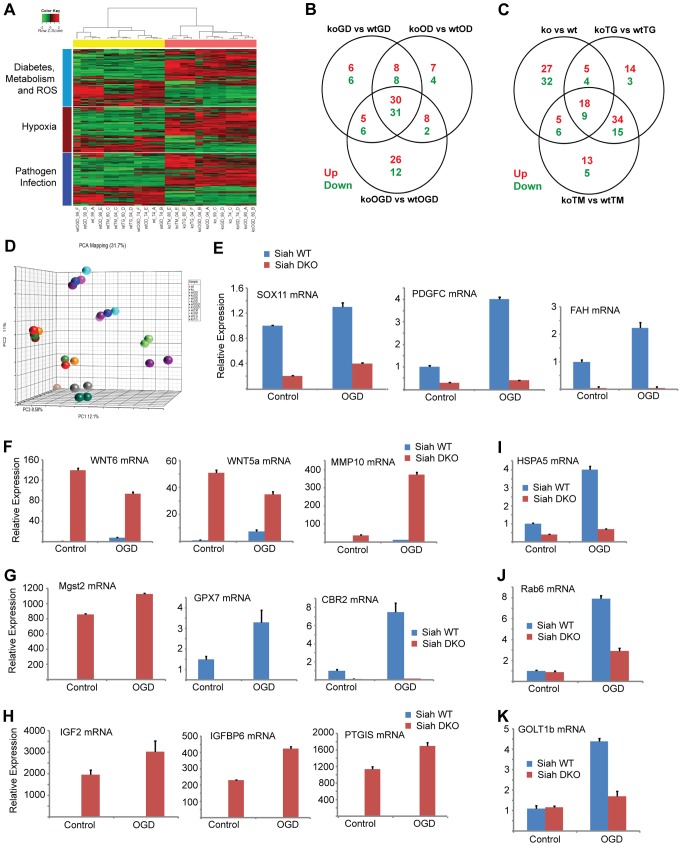
Figure 4. Siah1/2-dependent gene expression analysis confirms an ER stress signature.
(A) Heat map showing genes involved in diabetes, metabolism and ROS functions (light blue bar), hypoxia and related signaling (brown bar), and pathogen infection and related signaling (blue bar). Each bar represents a block of significant genes, which is involved in the same functional group. The selected genes have p-values less than or equal to 0.05 and fold-changes are greater than or equal to 2 (both directions). In the heatmap, the normalized expression signals are shown from green to red (lower signal to higher signal). The bars on the left of the heatmap indicate the functional groups. Each bar represents a block of significant genes, which involved in the same functional group. (B–C) Venn diagram representing the overlaps of significantly down- (green), and up- (red) expressed genes involved in the functional groups as indicated in the heatmap. Panel B shows genes from pairwise comparisons: knock out glucose deprivation (koGD) versus wtGD, ko oxygen deprivation (koOD) versus wtOD and ko oxygen and glucose deprivation (koOGD) versus wtOGD. Panel c shows genes from pairwise comparisons: ko versus wt, koTG versus wtTG and koTM versus wtTM. (D) Principal component analysis (PCA) 3D plot for the microarray data set. Each spot represents an individual array, and is colored based on treatment group. (E–H) Validation of representative genes from each of the main pathways identified to be Siah1/2-dependent. Siah WT and Siah1a+/−::Siah2−/− (double knock out; DKO) MEF cells were subjected to OGD for 12 h. The relative transcription level was determined by qPCR. Shown are representative genes of the hypoxia (panel E and F), and diabetes/metabolism (panel G and H) pathways found to exhibit increase or decrease expression upon KO of Siah1a/2. The results are shown as the mean values ± S.E. of three independent experiments. (I–K) RNA prepared from Siah1a/2 WT and Siah DKO MEF cells was used for qPCR analysis. The expression of the transcripts from HSPA5 (I), Rab6 (J), GOLT1b (K) were validated by real time qPCR analysis. The results are shown as the mean values ± S.E. of three independent experiments.

