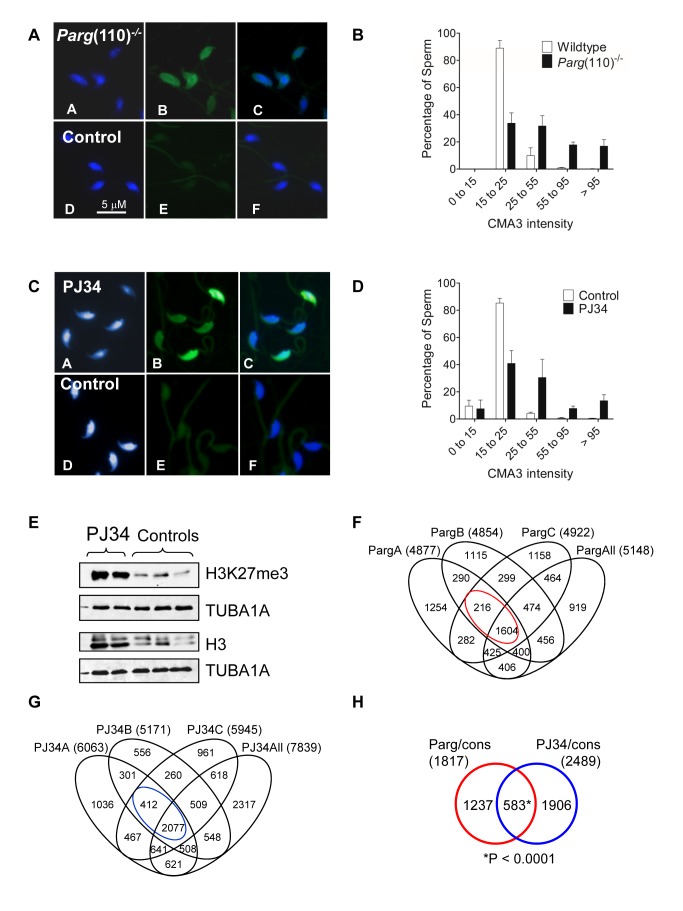
Figure 2. Aberrant chromatin composition in mouse models of altered PAR metabolism.
Chromomycin A3 (CMA3) intercalation into the DNA indicates incomplete chromatin condensation in sperm from Parg(110)−/− (A) and PJ34-treated (C) males with histone retention. (B, D) Histogram of sperm CMA3-staining intensities reflects that severity of CM3A staining varied at the level of individual sperm and individual fathers (n>200 nuclei/sample, 3 males/group). (E) Immunoblot analyses of sperm protein lysates showing increase in histone retention in PJ34 treated males. TUBA1A: alpha tubulin loading control. (F) Overlaps of genes identified as differentially histone associated in sperm from 3 individual Parg(110)−/− males (“PargA”, “PargB”, “PargC”, the fathers of the embryos analyzed below) by micrococcal nuclease digests (MND) compared to the wild-type controls. The “PargAll” data set contains all genes commonly identified as differentially MNase-sensitive across 10 Parg(110)−/− males compared with 9 wild-type control animals. The red circle indicates common genes that were differentially histone associated in all groups (1604+216 = 1820, red circle) compared with wild-type. (G) PJ34: differentially MNase-sensitive genes in three different males (like in E) and overlap with a surrogate dataset (“PJ34All”) consisting of data from all 4 PJ34-treated males compared with 9 wild-type control males. The overlap of 2,489 genes that were commonly differentially histone associated in sperm samples is indicated (blue circle). (H) Overlap of genes commonly affected by differential histone association between the Parg(110)−/− and the PJ34 models compared to wild-type controls (red and blue circles in F and G). A Pearson correlation examining significance of this overlap using a genetic background of 19,472 genes was calculated with a resulting P<0.0001, dismissing the null hypothesis that the observed overlap is coincidental (predicted number). The list and GO-term analysis of the 583 genes is contained in Dataset S4 (MS Excel).

