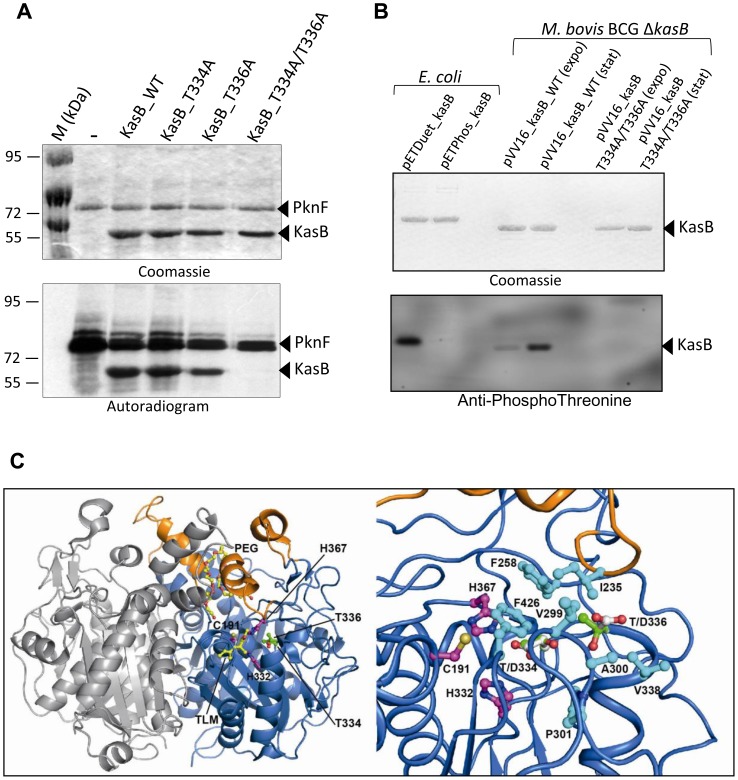
Figure 1. M. tuberculosis KasB is phosphorylated on Thr334 and Thr336. (A) In vitro phosphorylation of KasB with PknF.
The PknF kinase encoded by the Mtb genome was expressed and purified as a GST fusion and incubated with purified His-tagged KasB_WT, KasB_T334A, KasB_T336A and KasB_T334A/T336A in the presence of radiolabeled [γ-33]ATP. Samples were separated by SDS-PAGE, stained with Coomassie Blue and visualized by autoradiography after overnight exposure to a film as indicated. Upper bands reflect the autophosphorylation activity of PknF whereas the lower bands correspond to the phosphorylation signal of KasB. (B) In vivo phosphorylation of KasB. A kasB deletion mutant of M. bovis BCG was transformed with either pVV16_kasB_WT or pVV16_kasB_T334A/T336A and grown in Sauton medium. Exponential (expo) or stationary (stat) phase cells were harvested, lyzed and processed for KasB purification by affinity chromatography on Ni2+-containing beads. The BCG-derived KasB_WT and KasB_T334A/T336A proteins were separated by SDS-PAGE, either stained with Coomassie Blue (upper panel) or subjected to Western blot analysis after probing the membrane with anti-phosphoThreonine antibodies (lower panel). Specificity of phosphothreonine recognition was checked by probing the antibodies against recombinant KasB produced in E. coli strains carrying either pETPhos_kasB (non phosphorylated KasB) or pETDuet_kasB that co-expresses KasB with PknF (phosphorylated KasB). (C) Localization of Thr334 and Thr336 phospho-sites in the three-dimensional structure of KasB. Overall view (left panel) showing the KasB dimeric structure ([19]; PDB entry 2GP6) in ribbon representation with the core domain in marine and the cap domain in orange. The second chain of the dimer is in light gray. The Cys-His-His catalytic triad and the two phospho-sites are displayed as ball-and-stick with carbon atoms in magenta and green, respectively. Also shown with carbon atoms in yellow are the TLM inhibitor and the PEG molecule as observed in the structure of the KasA C171Q acyl enzyme mimic ([20]; PDB entry 2WGG). The PEG molecule is thought to delineate the acyl-binding channel [20]. Nitrogens are in blue, oxygens in red, and sulfur in gold. Close-up view (right panel) after a 45° rotation of the left panel along a vertical axis. Side-chains of residues delineating the active site hydrophobic tunnel and of aspartic residues at positions 334 and 336 were also represented (carbons in cyan and white, respectively).

