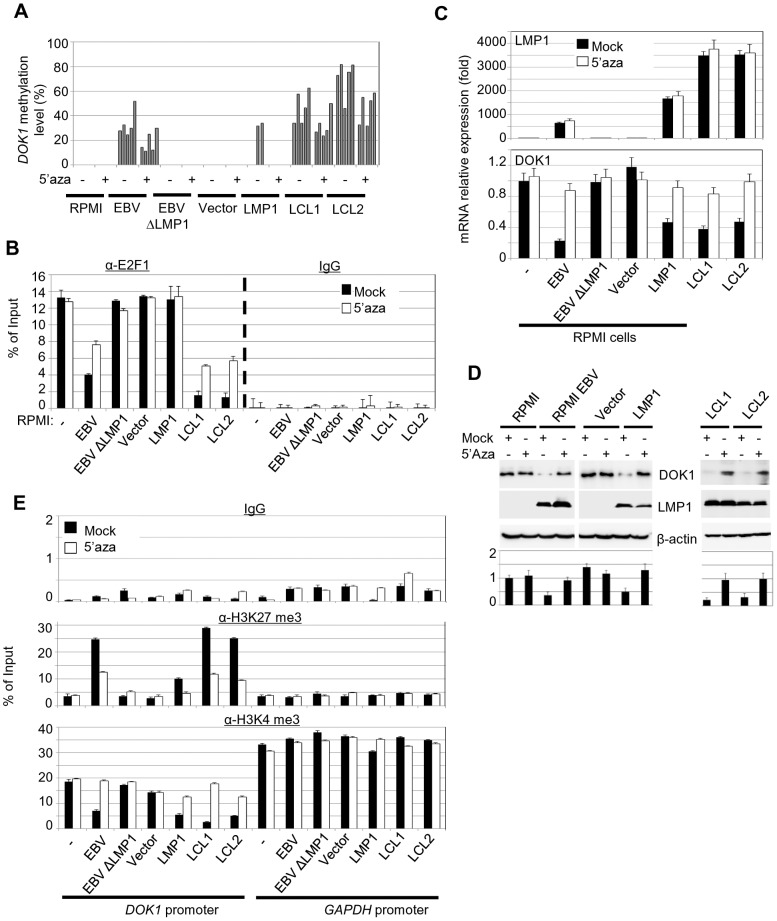
Figure 5. 5-Aza treatment rescue DOK1 expression in EBV infected cells.
Cells were treated with 1 µM methyl-transferase inhibitor 5-Aza-2′deoxycytidine (5-Aza) for 4 days or equivalent volume of DMSO (Mock), then collected for analysis. (A) DNA methylation levels of the DOK1 promoter were measured using pyrosequencing. Each bar represents the percentage of methylation for individual CpG sites. (B) Quantitative ChIP assay using anti-E2F1 (KH 95) antibody or IgG. The DOK1 promoter was amplified by real-time PCR using specific primers flanking the E2F-response element located at (−498/−486). Data were calculated as percentages of enrichment of input. Error bars indicate the standard deviation (SD) from two independent experiments performed in triplicate. (C) The mRNA expression levels of LMP1, GAPDH and DOK1 were determined using real time PCR. (D) The indicated proteins were analyzed using western blotting. DOK1 protein levels were quantified from two independent immunoblots and normalized to the corresponding β-actin level (bottom). (E) ChIP assays were carried out using anti-H3K27 trimethylation antibody, anti-H3K4 trimethylation antibody or IgG. The DOK1 promoter and GAPDH promoter were amplified by real-time PCR. Data were calculated as percentages of enrichment of input.

